Like most of us, [Peter] had a bit of extra time on his hands during quarantine and decided to take a look back at speech recognition technology in the 1970s. Quickly, he started thinking to himself, “Hmm…I wonder if I could do this with an Arduino Nano?” We’ve all probably had similar thoughts, but [Peter] really put his theory to the test.
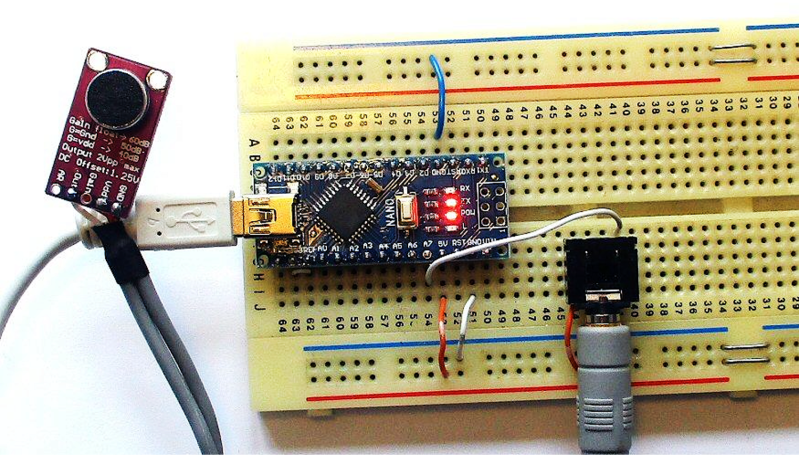
The hardware itself is pretty straightforward. There is an Arduino Nano to run the speech recognition algorithm and a MAX9814 microphone amplifier to capture the voice commands. However, the beauty of [Peter’s] approach, lies in his software implementation. [Peter] has a bit of an interplay between a custom PC program he wrote and the Arduino Nano. The learning aspect of his algorithm is done on a PC, but the implementation is done in real-time on the Arduino Nano, a typical approach for really any machine learning algorithm deployed on a microcontroller. To capture sample audio commands, or utterances, [Peter] first had to optimize the Nano’s ADC so he could get sufficient sample rates for speech processing. Doing a bit of low-level programming, he achieved a sample rate of 9ksps, which is plenty fast for audio processing.
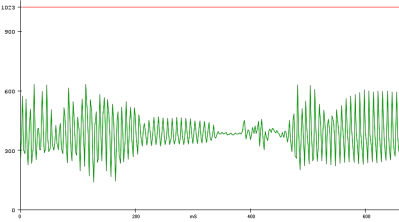
To analyze the utterances, he first divided each sample utterance into 50 ms segments. Think of dividing a single spoken word into its different syllables. Like analyzing the “se-” in “seven” separate from the “-ven.” 50 ms might be too long or too short to capture each syllable cleanly, but hopefully, that gives you a good mental picture of what [Peter’s] program is doing. He then calculated the energy of 5 different frequency bands, for every segment of every utterance. Normally that’s done using a Fourier transform, but the Nano doesn’t have enough processing power to compute the Fourier transform in real-time, so Peter tried a different approach. Instead, he implemented 5 sets of digital bandpass filters, allowing him to more easily compute the energy of the signal in each frequency band.
The energy of each frequency band for every segment is then sent to a PC where a custom-written program creates “templates” based on the sample utterances he generates. The crux of his algorithm is comparing how closely the energy of each frequency band for each utterance (and for each segment) is to the template. The PC program produces a .h file that can be compiled directly on the Nano. He uses the example of being able to recognize the numbers 0-9, but you could change those commands to “start” or “stop,” for example, if you would like to.
A few weeks ago I was asked about creating a musical-effect display with an RGB LED cube kit from our friends over at Freetronics, and with a little work this was certainly possible using the MSGEQ7 spectrum analyzer IC. In this project we’ll create a small add-on PCB containing the spectrum analyzer circuit and show how it can drive the RGB LED cube kit.
You can get the bare MSGEQ7 ICs from Sparkfun and the other usual suspects. It never hurts to have a spare one, so order two and matching IC sockets. Finally you should be able to translate a simple circuit to prototyping board.
The circuit
The LED cube already has an Arduino Leonardo-compatible built in to the main PCB, so all you need to do is build a small circuit that contains the spectrum analyzer which connects to the I/O pins on the cube PCB and also has audio input and output connections. First, consider the schematic:
For the purposes of this project our spectrum analyzer will only display the results from one channel of audio – if you want stereo, you’ll need two! And note that the strobe, reset and DCOUT pins on the MSGEQ7 are labelled with the connections to the cube PCB. Furthermore the pinouts for the MSGEQ7 don’t match the physical reality – here are the pinouts from the MSGEQ7 data sheet (.pdf):
The circuit itself will be quite small and fit on a small amount of stripboard or veroboard. There is plenty of room underneath the cube to fit the circuit if so desired:
With a few moments you should be able to trace out your circuit to match the board type you have, remember to double-check before soldering. You will also need to connect the audio in point after the 1000 pF capacitor to a source of audio, and also pass it through so you can connect powered speakers, headphones, etc.
One method of doing so would be to cut up a male-female audio extension lead, and connect the shield to the GND of the circuit, and the signal line to the audio input on the circuit. Or if you have the parts handy and some shielded cable, just make your own input and output leads:
Be sure to test for shorts between the signal and shield before soldering to the circuit board. When finished, you should have something neat that you can hide under the cube or elsewhere:
Double-check your soldering for shorts and your board plan, then fit to the cube along with the audio source and speakers (etc).
Arduino Sketch
The sketch has two main functions – the first is to capture the levels from the MSGEQ7 and put the values for each frequency band into an array, and the second function is to turn on LEDs that represent the level for each band. If you’ve been paying attention you may be wondering how we can represent seven frequency bands with a 4x4x4 LED cube. Simple – by rotating the cube 45 degrees you can see seven vertical columns of LEDs:
So when looking from the angle as shown above, you have seven vertical columns, each with four levels of LEDs. Thus the strength of each frequency can be broken down into four levels, and then the appropriate LEDs turned on.
After this is done for each band, all the LEDs are turned off and the process repeats. For the sake of simplicity I’ve used the cube’s Arduino library to activate the LEDs, which also makes the sketch easier to fathom. The first example sketch only uses one colour:
// Freetronics CUBE4: and MSGEQ7 spectrum analyser
// MSGEQ7 strobe on A4, reset on D5, signal into A0

#include "SPI.h"
#include "Cube.h"
Cube cube;

int res = 5; // reset pins on D5
int left[7]; // store band values in these arrays
int band;

void setup()
{
  pinMode(res, OUTPUT); // reset
  pinMode(A4, OUTPUT); // strobe
  digitalWrite(res,LOW);
  digitalWrite(A4,HIGH);
  cube.begin(-1, 115200);
  Serial.begin(9600);
}

void readMSGEQ7()
// Function to read 7 band equalizers
{
  digitalWrite(res, HIGH);
  digitalWrite(res, LOW);
  for(band=0; band <7; band++)
  {
    digitalWrite(A4,LOW); // strobe pin on the shield - kicks the IC up to the next band
    delayMicroseconds(30); //
    left[band] = analogRead(0); // store band reading
    digitalWrite(A4,HIGH);
  }
}

void loop()
{
  readMSGEQ7();

  for (band = 0; band < 7; band++)
  {
    // div each band strength into four layers, each band then one of the odd diagonals

    // band one ~ 63 Hz
    if (left[0]>=768) {
      cube.set(3,3,3, BLUE);
    }
    else
      if (left[0]>=512) {
      cube.set(3,3,2, BLUE);
    }
    else
      if (left[0]>=256) {
      cube.set(3,3,1, BLUE);
    }
    else
      if (left[0]>=0) {
      cube.set(3,3,0, BLUE);
    }

    // band two ~ 160 Hz
    if (left[1]>=768)
    {
      cube.set(3,2,3, BLUE);
      cube.set(2,3,3, BLUE);
    }
    else
      if (left[1]>=512)
      {
        cube.set(3,2,2, BLUE);
        cube.set(2,3,2, BLUE);
      }
      else
        if (left[1]>=256)
      {
        cube.set(3,2,1, BLUE);
        cube.set(2,3,1, BLUE);
      }
      else
        if (left[1]>=0)
      {
        cube.set(3,2,0, BLUE);
        cube.set(2,3,0, BLUE);
      }

    // band three ~ 400 Hz
    if (left[2]>=768)
    {
      cube.set(3,1,3, BLUE);
      cube.set(2,2,3, BLUE);
      cube.set(1,3,3, BLUE);
    }
    else
      if (left[2]>=512)
      {
        cube.set(3,1,2, BLUE);
        cube.set(2,2,2, BLUE);
        cube.set(1,3,2, BLUE);
      }
      else
        if (left[2]>=256)
      {
        cube.set(3,1,1, BLUE);
        cube.set(2,2,1, BLUE);
        cube.set(1,3,1, BLUE);
      }
      else
        if (left[2]>=0)
      {
        cube.set(3,1,0, BLUE);
        cube.set(2,2,0, BLUE);
        cube.set(1,3,0, BLUE);
      }

    // band four ~ 1 kHz
    if (left[3]>=768)
    {
      cube.set(3,0,3, BLUE);
      cube.set(2,1,3, BLUE);
      cube.set(1,2,3, BLUE);
      cube.set(0,3,3, BLUE);
    }
    else
      if (left[3]>=512)
      {
        cube.set(3,0,2, BLUE);
        cube.set(2,1,2, BLUE);
        cube.set(1,2,2, BLUE);
        cube.set(0,3,2, BLUE);
      }
      else
        if (left[3]>=256)
      {
        cube.set(3,0,1, BLUE);
        cube.set(2,1,1, BLUE);
        cube.set(1,2,1, BLUE);
        cube.set(0,3,1, BLUE);
      }
      else
        if (left[3]>=0)
      {
        cube.set(3,0,0, BLUE);
        cube.set(2,1,0, BLUE);
        cube.set(1,2,0, BLUE);
        cube.set(0,3,0, BLUE);
      }

    // band five  ~ 2.5 kHz
    if (left[4]>=768)
    {
      cube.set(2,0,3, BLUE);
      cube.set(1,1,3, BLUE);
      cube.set(0,2,3, BLUE);
    }
    else
      if (left[4]>=512)
      {
        cube.set(2,0,2, BLUE);
        cube.set(1,1,2, BLUE);
        cube.set(0,2,2, BLUE);
      }
      else
        if (left[4]>=256)
      {
        cube.set(2,0,1, BLUE);
        cube.set(1,1,1, BLUE);
        cube.set(0,2,1, BLUE);
      }
      else
        if (left[4]>=0)
      {
        cube.set(2,0,0, BLUE);
        cube.set(1,1,0, BLUE);
        cube.set(0,2,0, BLUE);
      }

    // band six   ~ 6.25 kHz
    if (left[5]>=768)
    {
      cube.set(1,0,3, BLUE);
      cube.set(0,1,3, BLUE);
    }
    else
      if (left[5]>=512)
      {
        cube.set(1,0,2, BLUE);
        cube.set(0,1,2, BLUE);
      }
      else
        if (left[5]>=256)
      {
        cube.set(1,0,1, BLUE);
        cube.set(0,1,1, BLUE);
      }
      else
        if (left[5]>=0)
      {
        cube.set(1,0,0, BLUE);
        cube.set(0,1,0, BLUE);
      }

    // band seven  ~ 16 kHz
    if (left[6]>=768)
    {
      cube.set(0,0,3, BLUE);
    }
    else
      if (left[6]>=512)
      {
        cube.set(0,0,2, BLUE);
      }
      else
        if (left[6]>=256)
      {
        cube.set(0,0,1, BLUE);
      }
      else
        if (left[6]>=0)
      {
        cube.set(0,0,0, BLUE);
      }
  }
  // now clear the CUBE, or if that's too slow - repeat the process but turn LEDs off
  cube.all(BLACK);
}
… and a quick video demonstration:
For a second example, we’ve used various colours:
// Freetronics CUBE4: and MSGEQ7 spectrum analyser
// MSGEQ7 strobe on A4, reset on D5, signal into A0
// now in colour!

#include "SPI.h"
#include "Cube.h"
Cube cube;

int res = 5; // reset pins on D5
int left[7]; // store band values in these arrays
int band;
int additional=0;

void setup()
{
  pinMode(res, OUTPUT); // reset
  pinMode(A4, OUTPUT); // strobe
  digitalWrite(res,LOW);
  digitalWrite(A4,HIGH);
  cube.begin(-1, 115200);
  Serial.begin(9600);
}

void readMSGEQ7()
// Function to read 7 band equalizers
{
  digitalWrite(res, HIGH);
  digitalWrite(res, LOW);
  for(band=0; band <7; band++)
  {
    digitalWrite(A4,LOW); // strobe pin on the shield - kicks the IC up to the next band
    delayMicroseconds(30); //
    left[band] = analogRead(0) + additional; // store band reading
    digitalWrite(A4,HIGH);
  }
}

void loop()
{
  readMSGEQ7();

  for (band = 0; band < 7; band++)
  {
    // div each band strength into four layers, each band then one of the odd diagonals

    // band one ~ 63 Hz
    if (left[0]>=768) {
      cube.set(3,3,3, RED);
    }
    else
      if (left[0]>=512) {
      cube.set(3,3,2, YELLOW);
    }
    else
      if (left[0]>=256) {
      cube.set(3,3,1, YELLOW);
    }
    else
      if (left[0]>=0) {
      cube.set(3,3,0, BLUE);
    }

    // band two ~ 160 Hz
    if (left[1]>=768)
    {
      cube.set(3,2,3, RED);
      cube.set(2,3,3, RED);
    }
    else
      if (left[1]>=512)
      {
        cube.set(3,2,2, YELLOW);
        cube.set(2,3,2, YELLOW);
      }
      else
        if (left[1]>=256)
      {
        cube.set(3,2,1, YELLOW);
        cube.set(2,3,1, YELLOW);
      }
      else
        if (left[1]>=0)
      {
        cube.set(3,2,0, BLUE);
        cube.set(2,3,0, BLUE);
      }

    // band three ~ 400 Hz
    if (left[2]>=768)
    {
      cube.set(3,1,3, RED);
      cube.set(2,2,3, RED);
      cube.set(1,3,3, RED);
    }
    else
      if (left[2]>=512)
      {
        cube.set(3,1,2, YELLOW);
        cube.set(2,2,2, YELLOW);
        cube.set(1,3,2, YELLOW);
      }
      else
        if (left[2]>=256)
      {
        cube.set(3,1,1, YELLOW);
        cube.set(2,2,1, YELLOW);
        cube.set(1,3,1, YELLOW);
      }
      else
        if (left[2]>=0)
      {
        cube.set(3,1,0, BLUE);
        cube.set(2,2,0, BLUE);
        cube.set(1,3,0, BLUE);
      }

    // band four ~ 1 kHz
    if (left[3]>=768)
    {
      cube.set(3,0,3, RED);
      cube.set(2,1,3, RED);
      cube.set(1,2,3, RED);
      cube.set(0,3,3, RED);
    }
    else
      if (left[3]>=512)
      {
        cube.set(3,0,2, YELLOW);
        cube.set(2,1,2, YELLOW);
        cube.set(1,2,2, YELLOW);
        cube.set(0,3,2, YELLOW);
      }
      else
        if (left[3]>=256)
      {
        cube.set(3,0,1, YELLOW);
        cube.set(2,1,1, YELLOW);
        cube.set(1,2,1, YELLOW);
        cube.set(0,3,1, YELLOW);
      }
      else
        if (left[3]>=0)
      {
        cube.set(3,0,0, BLUE);
        cube.set(2,1,0, BLUE);
        cube.set(1,2,0, BLUE);
        cube.set(0,3,0, BLUE);
      }

    // band five  ~ 2.5 kHz
    if (left[4]>=768)
    {
      cube.set(2,0,3, RED);
      cube.set(1,1,3, RED);
      cube.set(0,2,3, RED);
    }
    else
      if (left[4]>=512)
      {
        cube.set(2,0,2, YELLOW);
        cube.set(1,1,2, YELLOW);
        cube.set(0,2,2, YELLOW);
      }
      else
        if (left[4]>=256)
      {
        cube.set(2,0,1, YELLOW);
        cube.set(1,1,1, YELLOW);
        cube.set(0,2,1, YELLOW);
      }
      else
        if (left[4]>=0)
      {
        cube.set(2,0,0, BLUE);
        cube.set(1,1,0, BLUE);
        cube.set(0,2,0, BLUE);
      }

    // band six   ~ 6.25 kHz
    if (left[5]>=768)
    {
      cube.set(1,0,3, RED);
      cube.set(0,1,3, RED);
    }
    else
      if (left[5]>=512)
      {
        cube.set(1,0,2, YELLOW);
        cube.set(0,1,2, YELLOW);
      }
      else
        if (left[5]>=256)
      {
        cube.set(1,0,1, YELLOW);
        cube.set(0,1,1, YELLOW);
      }
      else
        if (left[5]>=0)
      {
        cube.set(1,0,0, BLUE);
        cube.set(0,1,0, BLUE);
      }

    // band seven  ~ 16 kHz
    if (left[6]>=768)
    {
      cube.set(0,0,3, RED);
    }
    else
      if (left[6]>=512)
      {
        cube.set(0,0,2, YELLOW);
      }
      else
        if (left[6]>=256)
      {
        cube.set(0,0,1, YELLOW);
      }
      else
        if (left[6]>=0)
      {
        cube.set(0,0,0, BLUE);
      }
  }
  // now clear the CUBE, or if that's too slow - repeat the process but turn LEDs off
  cube.all(BLACK);
}
… and the second video demonstration:
A little bit of noise comes through into the spectrum analyzer, most likely due to the fact that the entire thing is unshielded. The previous prototype used the Arduino shield from the tutorial which didn’t have this problem, so if you’re keen perhaps make your own custom PCB for this project.
Conclusion
Well that was something different and I hope you enjoyed it, and can find use for the circuit. That MSGEQ7 is a handy IC and with some imagination you can create a variety of musically-influenced displays. And while you’re here – are you interested in learning more about Arduino? Then order my new book “Arduino Workshop” from No Starch Press.
In the meanwhile have fun and keep checking into tronixstuff.com. Why not follow things on twitter, Google+, subscribe for email updates or RSS using the links on the right-hand column? And join our friendly Google Group – dedicated to the projects and related items on this website. Sign up – it’s free, helpful to each other – and we can all learn something.
Finally, cold cathode lights can be used for much more than illuminating the inside of your computer or making your whip look like it can hover. [James] discovered if he varied the voltage going into the inverter, only a certain amount of the tube would light up. Give a hacker an interesting observation and enough time, and eventually he’ll come up with something really cool. In this case, it’s a cold cathode audio visualizer, powered by fluorescent tubes doing unexpected things.
The build details are a little scant, but we were able to coax an imgur album of [James]‘ build. He’s using these 20″ CCFL lights with the stock digital inverters replaced with TDK CCFL inverters.
The digital control of this build is provided by an Arduino Mega and a custom shield. We’re guessing the graphic EQ is provided by an MSGEQ7 chip, and the inverters themselves are powered through the Mega’s PWM pins. It’s a lot like an IN-9 Nixie graphic EQ, only much, much bigger. [James] is planning a larger version of this build, dubbed the Mega speKtrum and we can’t wait to see that build along with a proper writeup.
This is a tutorial on using the MSGEQ7 Spectrum Analyser with Arduino, and chapter forty-eight of a series originally titled “Getting Started/Moving Forward with Arduino!” by John Boxall – A tutorial on the Arduino universe. The first chapter is here, the complete series is detailed here.
Updated 30/01/2013
In this article we’re going to explain how to make simple spectrum analysers with an Arduino-style board. (Analyser? Analyzer? Take your pick).
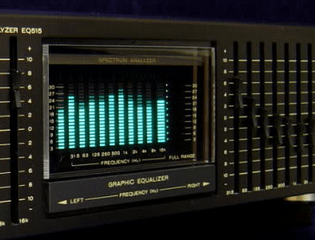
First of all, what is a spectrum analyser? Good question. Do you remember what this is?
It’s a mixed graphic equaliser/spectrum analyser deck for a hi-fi system. The display in the middle is the spectrum analyser, and roughly-speaking it shows the strength of different frequencies in the music being listened to – and looked pretty awesome doing it. We can recreate displays similar to this for entertainment and also as a base for creative lighting effects. By working through this tutorial you’ll have the base knowledge to recreate these yourself.
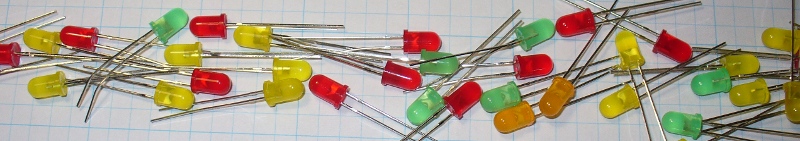
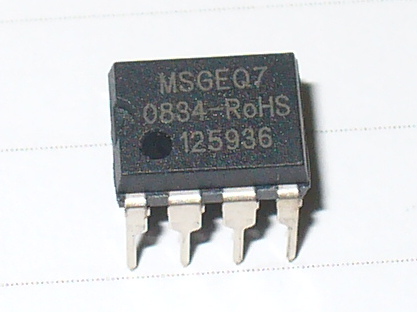
We’ll be using the MSGEQ7 “seven band graphic equaliser IC” from Mixed Signal Integration. Here’s the MSGEQ7 data sheet (.pdf). This little IC can accept a single audio source, analyse seven frequency bands of the audio, and output a DC representation of each frequency band. This isn’t super-accurate or calibrated in any way, but it works. You can get the IC separately, for example:
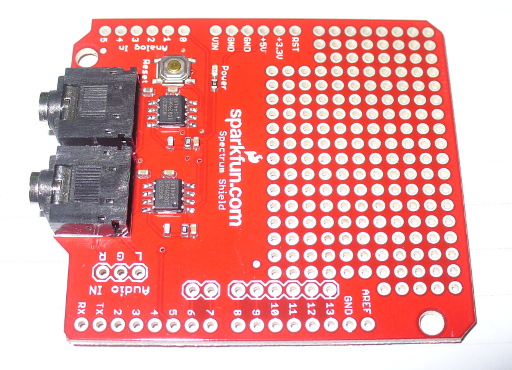
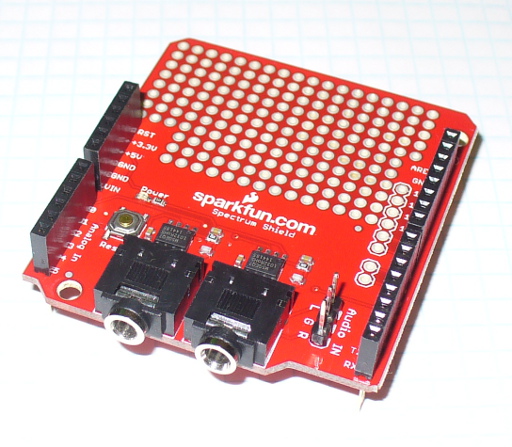
and then build your own circuit around it… or like most things in the Arduino world – get a shield. In this case, a derivative of the original Bliptronics shield by Sparkfun. It’s designed to pass through stereo audio via 3.5mm audio sockets and contains two MSGEQ7s, so we can do a stereo analyser:
As usual Sparkfun have saved a few cents by not including the stackable header sockets, so you’ll need to buy and solder those in yourself. There is also space for three header pins for direct audio input (left, right and common), which are useful – so if you can add those as well.
So now you have a shield that’s ready for use. Before moving forward let’s examine how the MSGEQ7 works for us. As mentioned earlier, it analyses seven frequency bands. These are illustrated in the following graph from the data sheet:
It will return the strengths of the audio at seven points – 63 Hz, 160 Hz, 400 Hz, 1 kHz, 2.5 kHz, 6.25 kHz and 16 kHz – and as you can see there is some overlap between the bands. The strength is returned as a DC voltage – which we can then simply measure with the Arduino’s analogue input and create a display of some sort. At this point audio purists, Sheldonites and RF people might get a little cranky, so once again – this is more for visual indication than any sort of calibration device.
However as an 8-pin IC a different approach is required to get the different levels. The IC will sequentially give out the levels for each band on pin 3- e.g. 63 Hz then 160 Hz then 400 Hz then 1 kHz then 2.5 kHz then 6.25 kHz then 16 kHz then back to 63 Hz and so on. To start this sequence we first reset the IC by pulsing the RESET pin HIGH then low. This tells the IC to start at the first band. Next, we set the STROBE pin to LOW, take the DC reading from pin 3 with analogue input, store the value in a variable (an array), then set the STROBE pin HIGH. We repeat the strobe-measure sequence six more times to get the rest of the data, then RESET the IC and start all over again. For the visual learners consider the diagram below from the data sheet:
To demonstrate this process, consider the function
// Example 48.1 - tronixstuff.com/tutorials > chapter 48 - 30 Jan 2013
// MSGEQ7 spectrum analyser shield - basic demonstration
int strobe = 4; // strobe pins on digital 4
int res = 5; // reset pins on digital 5
int left[7]; // store band values in these arrays
int right[7];
int band;
void setup()
{
 Serial.begin(115200);
 pinMode(res, OUTPUT); // reset
 pinMode(strobe, OUTPUT); // strobe
 digitalWrite(res,LOW); // reset low
 digitalWrite(strobe,HIGH); //pin 5 is RESET on the shield
}
void readMSGEQ7()
// Function to read 7 band equalizers
{
 digitalWrite(res, HIGH);
 digitalWrite(res, LOW);
 for(band=0; band <7; band++)
 {
 digitalWrite(strobe,LOW); // strobe pin on the shield - kicks the IC up to the next band
 delayMicroseconds(30); //
 left[band] = analogRead(0); // store left band reading
 right[band] = analogRead(1); // ... and the right
 digitalWrite(strobe,HIGH);
 }
}
void loop()
{
 readMSGEQ7();
 // display values of left channel on serial monitor
 for (band = 0; band < 7; band++)
 {
 Serial.print(left[band]);
 Serial.print(" ");
 }
 Serial.println();
// display values of right channel on serial monitor
 for (band = 0; band < 7; band++)
 {
 Serial.print(right[band]);
 Serial.print(" ");
 }
 Serial.println();
}
If you follow through the sketch, you can see that it reads both left- and right-channel values from the two MSGEQ7s on the shield, then stores each value in the arrays left[] and right[]. These values are then sent to the serial monitor for display – for example:
If you have a function generator, connect the output to one of the channels and GND – then adjust the frequency and amplitude to see how the values change. The following video clip is a short demonstration of this – we set the generator to 1 kHz and adjust the amplitude of the signal. To make things easier to read we only measure and display the left channel:
Keep an eye on the fourth column of data – this is the analogRead() value returned by the Arduino when reading the 1khz frequency band. You can also see the affect on the other bands around 1 kHz as we increase and decrease the frequency. However that wasn’t really visually appealing – so now we’ll create a small and large graphical version.
First we’ll use an inexpensive LCD, the I2C model from akafugu reviewed previously. To save repeating myself, also review how to create custom LCD characters from here.
With the LCD with have two rows of sixteen characters. The plan is to use the top row for the levels, the left-channel’s on … the left, and the right on the right. Each character will be a little bar graph for the level. The bottom row can be for a label. We don’t have too many pixels to work with, but it’s a compact example:
We have eight rows for each character, and the results from an analogueRead() fall between 0 and 1023. So that’s 1024 possible values spread over eight sections. Thus each row of pixels in each character will represent 128 “units of analogue read” or around 0.63 V if the Arduino is running from true 5 V (remember your AREF notes?). The sketch will again read the values from the MSGEQ7, feed them into two arrays – then display the required character in each band space on the LCD.
pinMode(res, OUTPUT); // reset
pinMode(strobe, OUTPUT); // strobe
digitalWrite(res,LOW); // reset low
digitalWrite(strobe,HIGH); //pin 5 is RESET on the shield
}
void readMSGEQ7()
// Function to read 7 band equalizers
{
digitalWrite(res, HIGH);
digitalWrite(res, LOW);
for( band = 0; band < 7; band++ )
{
digitalWrite(strobe,LOW); // strobe pin on the shield - kicks the IC up to the next band
delayMicroseconds(30); //
left[band] = analogRead(0); // store left band reading
right[band] = analogRead(1); // ... and the right
digitalWrite(strobe,HIGH);
}
}
void loop()
{
readMSGEQ7();
// display values of left channel on LCD
for( band = 0; band < 7; band++ )
{
lcd.setCursor(band,0);
if (left[band]>=895) { lcd.write(7); } else
if (left[band]>=767) { lcd.write(6); } else
if (left[band]>=639) { lcd.write(5); } else
if (left[band]>=511) { lcd.write(4); } else
if (left[band]>=383) { lcd.write(3); } else
if (left[band]>=255) { lcd.write(2); } else
if (left[band]>=127) { lcd.write(1); } else
if (left[band]>=0) { lcd.write(0); }
}
// display values of right channel on LCD
for( band = 0; band < 7; band++ )
{
lcd.setCursor(band+9,0);
if (right[band]>=895) { lcd.write(7); } else
if (right[band]>=767) { lcd.write(6); } else
if (right[band]>=639) { lcd.write(5); } else
if (right[band]>=511) { lcd.write(4); } else
if (right[band]>=383) { lcd.write(3); } else
if (right[band]>=255) { lcd.write(2); } else
if (right[band]>=127) { lcd.write(1); } else
if (right[band]>=0) { lcd.write(0); }
}
}
If you’ve been reading through my tutorials there isn’t anything new to worry about. And now for the demo, with sound -
That would look great on the side of a Walkman, however it’s a bit small. Let’s scale it up by using a Freetronics Dot Matrix Display - you may recall these from Clock One. For some background knowledge check the review here. Don’t forget to use a suitable power supply for the DMD – 5 V at 4 A will do nicely. The DMD contains 16 rows of 32 LEDs. This gives us twice the “resolution” to display each band level if desired. The display style is subjective, so for this example we’ll use a single column of LEDs for each frequency band, with a blank column between each one.
We use a lot of line-drawing statements to display the levels, and clear the DMD after each display. With this and the previous sketches, there could be room for efficiency – however I write these with the beginner in mind. Here’s the sketch (download):
// Example 48.3 - tronixstuff.com/tutorials > chapter 48 - 30 Jan 2013
// MSGEQ7 spectrum analyser shield with a Freetronics DMD
// for DMD
#include // for DMD
#include // SPI.h must be included as DMD is written by SPI (the IDE complains otherwise)
#include
#include "SystemFont5x7.h" // keep next two lines if you want to add some text
#include "Arial_black_16.h"
DMD dmd(1, 1); // creates instance of DMD to refer to in sketch
void ScanDMD() // necessary interrupt handler for refresh scanning of DMD
{
dmd.scanDisplayBySPI();
}
int strobe = 4; // strobe pins on digital 4
int res = 5; // reset pins on digital 5
int left[7]; // store band values in these arrays
int right[7];
int band;
void setup()
{
// for DMD
//initialize TimerOne's interrupt/CPU usage used to scan and refresh the display
Timer1.initialize( 5000 ); //period in microseconds to call ScanDMD. Anything longer than 5000 (5ms) and you can see flicker.
Timer1.attachInterrupt( ScanDMD ); //attach the Timer1 interrupt to ScanDMD which goes to dmd.scanDisplayBySPI()
dmd.clearScreen( true ); //true is normal (all pixels off), false is negative (all pixels on)
// for MSGEQ7
pinMode(res, OUTPUT); // reset
pinMode(strobe, OUTPUT); // strobe
digitalWrite(res,LOW); // reset low
digitalWrite(strobe,HIGH); //pin 5 is RESET on the shield
}
void readMSGEQ7()
// Function to read 7 band equalizers
{
digitalWrite(res, HIGH);
digitalWrite(res, LOW);
for( band = 0; band < 7; band++ )
{
digitalWrite(strobe,LOW); // strobe pin on the shield - kicks the IC up to the next band
delayMicroseconds(30); //
left[band] = analogRead(0); // store left band reading
right[band] = analogRead(1); // ... and the right
digitalWrite(strobe,HIGH);
}
}
void loop()
{
int xpos;
readMSGEQ7();
dmd.clearScreen( true );
// display values of left channel on DMD
for( band = 0; band < 7; band++ )
{
xpos = (band*2)+1;
if (left[band]>=895) { dmd.drawLine( xpos, 15, xpos, 1, GRAPHICS_NORMAL ); } else
if (left[band]>=767) { dmd.drawLine( xpos, 15, xpos, 3, GRAPHICS_NORMAL ); } else
if (left[band]>=639) { dmd.drawLine( xpos, 15, xpos, 5, GRAPHICS_NORMAL ); } else
if (left[band]>=511) { dmd.drawLine( xpos, 15, xpos, 7, GRAPHICS_NORMAL ); } else
if (left[band]>=383) { dmd.drawLine( xpos, 15, xpos, 9, GRAPHICS_NORMAL ); } else
if (left[band]>=255) { dmd.drawLine( xpos, 15, xpos, 11, GRAPHICS_NORMAL ); } else
if (left[band]>=127) { dmd.drawLine( xpos, 15, xpos, 13, GRAPHICS_NORMAL ); } else
if (left[band]>=0) { dmd.drawLine( xpos, 15, xpos, 15, GRAPHICS_NORMAL ); }
}
// display values of right channel on DMD
for( band = 0; band < 7; band++ )
{
xpos = (band*2)+18;
if (right[band]>=895) { dmd.drawLine( xpos, 15, xpos, 1, GRAPHICS_NORMAL ); } else
if (right[band]>=767) { dmd.drawLine( xpos, 15, xpos, 3, GRAPHICS_NORMAL ); } else
if (right[band]>=639) { dmd.drawLine( xpos, 15, xpos, 5, GRAPHICS_NORMAL ); } else
if (right[band]>=511) { dmd.drawLine( xpos, 15, xpos, 7, GRAPHICS_NORMAL ); } else
if (right[band]>=383) { dmd.drawLine( xpos, 15, xpos, 9, GRAPHICS_NORMAL ); } else
if (right[band]>=255) { dmd.drawLine( xpos, 15, xpos, 11, GRAPHICS_NORMAL ); } else
if (right[band]>=127) { dmd.drawLine( xpos, 15, xpos, 13, GRAPHICS_NORMAL ); } else
if (right[band]>=0) { dmd.drawLine( xpos, 15, xpos, 15, GRAPHICS_NORMAL ); }
}
}
… and here it is in action:
Conclusion
At this point you have the knowledge to use the MSGEQ7 ICs to create some interesting spectrum analysers for entertainment and visual appeal – now you just choose the type of display enjoy the results.
Have fun and keep checking into tronixstuff.com. Why not follow things on twitter, Google+, subscribe for email updates or RSS using the links on the right-hand column, or join our Google Group – dedicated to the projects and related items on this website. Sign up – it’s free, helpful to each other – and we can all learn something.
This is a tutorial on using the MSGEQ7 Spectrum Analyser with Arduino, and chapter forty-eight of a series originally titled “Getting Started/Moving Forward with Arduino!” by John Boxall – A tutorial on the Arduino universe. The first chapter is here, the complete series is detailed here.
Updated 30/01/2013
In this article we’re going to explain how to make simple spectrum analysers with an Arduino-style board. (Analyser? Analyzer? Take your pick).
First of all, what is a spectrum analyser? Good question. Do you remember what this is?
It’s a mixed graphic equaliser/spectrum analyser deck for a hi-fi system. The display in the middle is the spectrum analyser, and roughly-speaking it shows the strength of different frequencies in the music being listened to – and looked pretty awesome doing it. We can recreate displays similar to this for entertainment and also as a base for creative lighting effects. By working through this tutorial you’ll have the base knowledge to recreate these yourself.
We’ll be using the MSGEQ7 “seven band graphic equaliser IC” from Mixed Signal Integration. Here’s the MSGEQ7 data sheet (.pdf). This little IC can accept a single audio source, analyse seven frequency bands of the audio, and output a DC representation of each frequency band. This isn’t super-accurate or calibrated in any way, but it works. You can get the IC separately, for example:
and then build your own circuit around it… or like most things in the Arduino world – get a shield. In this case, a derivative of the original Bliptronics shield by Sparkfun. It’s designed to pass through stereo audio via 3.5mm audio sockets and contains two MSGEQ7s, so we can do a stereo analyser:
As usual Sparkfun have saved a few cents by not including the stackable header sockets, so you’ll need to buy and solder those in yourself. There is also space for three header pins for direct audio input (left, right and common), which are useful – so if you can add those as well.
So now you have a shield that’s ready for use. Before moving forward let’s examine how the MSGEQ7 works for us. As mentioned earlier, it analyses seven frequency bands. These are illustrated in the following graph from the data sheet:
It will return the strengths of the audio at seven points – 63 Hz, 160 Hz, 400 Hz, 1 kHz, 2.5 kHz, 6.25 kHz and 16 kHz – and as you can see there is some overlap between the bands. The strength is returned as a DC voltage – which we can then simply measure with the Arduino’s analogue input and create a display of some sort. At this point audio purists, Sheldonites and RF people might get a little cranky, so once again – this is more for visual indication than any sort of calibration device.
However as an 8-pin IC a different approach is required to get the different levels. The IC will sequentially give out the levels for each band on pin 3- e.g. 63 Hz then 160 Hz then 400 Hz then 1 kHz then 2.5 kHz then 6.25 kHz then 16 kHz then back to 63 Hz and so on. To start this sequence we first reset the IC by pulsing the RESET pin HIGH then low. This tells the IC to start at the first band. Next, we set the STROBE pin to LOW, take the DC reading from pin 3 with analogue input, store the value in a variable (an array), then set the STROBE pin HIGH. We repeat the strobe-measure sequence six more times to get the rest of the data, then RESET the IC and start all over again. For the visual learners consider the diagram below from the data sheet:
To demonstrate this process, consider the function
readMSGEQ7()
in the following example sketch:
// Example 48.1 - tronixstuff.com/tutorials > chapter 48 - 30 Jan 2013
// MSGEQ7 spectrum analyser shield - basic demonstration
int strobe = 4; // strobe pins on digital 4
int res = 5; // reset pins on digital 5
int left[7]; // store band values in these arrays
int right[7];
int band;
void setup()
{
Serial.begin(115200);
pinMode(res, OUTPUT); // reset
pinMode(strobe, OUTPUT); // strobe
digitalWrite(res,LOW); // reset low
digitalWrite(strobe,HIGH); //pin 5 is RESET on the shield
}
void readMSGEQ7()
// Function to read 7 band equalizers
{
digitalWrite(res, HIGH);
digitalWrite(res, LOW);
for(band=0; band <7; band++)
{
digitalWrite(strobe,LOW); // strobe pin on the shield - kicks the IC up to the next band
delayMicroseconds(30); //
left[band] = analogRead(0); // store left band reading
right[band] = analogRead(1); // ... and the right
digitalWrite(strobe,HIGH);
}
}
void loop()
{
readMSGEQ7();
// display values of left channel on serial monitor
for (band = 0; band < 7; band++)
{
Serial.print(left[band]);
Serial.print(" ");
}
Serial.println();
// display values of right channel on serial monitor
for (band = 0; band < 7; band++)
{
Serial.print(right[band]);
Serial.print(" ");
}
Serial.println();
}
If you follow through the sketch, you can see that it reads both left- and right-channel values from the two MSGEQ7s on the shield, then stores each value in the arrays left[] and right[]. These values are then sent to the serial monitor for display – for example:
If you have a function generator, connect the output to one of the channels and GND – then adjust the frequency and amplitude to see how the values change. The following video clip is a short demonstration of this – we set the generator to 1 kHz and adjust the amplitude of the signal. To make things easier to read we only measure and display the left channel:
Keep an eye on the fourth column of data – this is the analogRead() value returned by the Arduino when reading the 1khz frequency band. You can also see the affect on the other bands around 1 kHz as we increase and decrease the frequency. However that wasn’t really visually appealing – so now we’ll create a small and large graphical version.
First we’ll use an inexpensive LCD, the I2C model from akafugu reviewed previously. To save repeating myself, also review how to create custom LCD characters from here.
With the LCD with have two rows of sixteen characters. The plan is to use the top row for the levels, the left-channel’s on … the left, and the right on the right. Each character will be a little bar graph for the level. The bottom row can be for a label. We don’t have too many pixels to work with, but it’s a compact example:
We have eight rows for each character, and the results from an analogueRead() fall between 0 and 1023. So that’s 1024 possible values spread over eight sections. Thus each row of pixels in each character will represent 128 “units of analogue read” or around 0.63 V if the Arduino is running from true 5 V (remember your AREF notes?). The sketch will again read the values from the MSGEQ7, feed them into two arrays – then display the required character in each band space on the LCD.
Here’s the resulting sketch:
// Example 48.2 - tronixstuff.com/tutorials > chapter 48 - 30 Jan 2013
// MSGEQ7 spectrum analyser shield and I2C LCD from akafugu
// for akafugu I2C LCD
#include "Wire.h"
#include "TWILiquidCrystal.h"
LiquidCrystal lcd(50);
// create custom characters for LCD
byte level0[8] = { 0b00000, 0b00000, 0b00000, 0b00000, 0b00000, 0b00000, 0b00000, 0b11111};
byte level1[8] = { 0b00000, 0b00000, 0b00000, 0b00000, 0b00000, 0b00000, 0b11111, 0b11111};
byte level2[8] = { 0b00000, 0b00000, 0b00000, 0b00000, 0b00000, 0b11111, 0b11111, 0b11111};
byte level3[8] = { 0b00000, 0b00000, 0b00000, 0b00000, 0b11111, 0b11111, 0b11111, 0b11111};
byte level4[8] = { 0b00000, 0b00000, 0b00000, 0b11111, 0b11111, 0b11111, 0b11111, 0b11111};
byte level5[8] = { 0b00000, 0b00000, 0b11111, 0b11111, 0b11111, 0b11111, 0b11111, 0b11111};
byte level6[8] = { 0b00000, 0b11111, 0b11111, 0b11111, 0b11111, 0b11111, 0b11111, 0b11111};
byte level7[8] = { 0b11111, 0b11111, 0b11111, 0b11111, 0b11111, 0b11111, 0b11111, 0b11111};
int strobe = 4; // strobe pins on digital 4
int res = 5; // reset pins on digital 5
int left[7]; // store band values in these arrays
int right[7];
int band;
void setup()
{
 Serial.begin(9600);
 // setup LCD and custom characters
 lcd.begin(16, 2);
 lcd.setContrast(24);
 lcd.clear();
lcd.createChar(0,level0);
 lcd.createChar(1,level1);
 lcd.createChar(2,level2);
 lcd.createChar(3,level3);
 lcd.createChar(4,level4);
 lcd.createChar(5,level5);
 lcd.createChar(6,level6);
 lcd.createChar(7,level7);
 lcd.setCursor(0,1);
 lcd.print("Left");
 lcd.setCursor(11,1);
 lcd.print("Right");
 pinMode(res, OUTPUT); // reset
 pinMode(strobe, OUTPUT); // strobe
 digitalWrite(res,LOW); // reset low
 digitalWrite(strobe,HIGH); //pin 5 is RESET on the shield
}
void readMSGEQ7()
// Function to read 7 band equalizers
{
 digitalWrite(res, HIGH);
 digitalWrite(res, LOW);
 for( band = 0; band < 7; band++ )
 {
 digitalWrite(strobe,LOW); // strobe pin on the shield - kicks the IC up to the next band
 delayMicroseconds(30); //
 left[band] = analogRead(0); // store left band reading
 right[band] = analogRead(1); // ... and the right
 digitalWrite(strobe,HIGH);
 }
}
void loop()
{
 readMSGEQ7();
// display values of left channel on LCD
 for( band = 0; band < 7; band++ )
 {
 lcd.setCursor(band,0);
 if (left[band]>=895) { lcd.write(7); } else
 if (left[band]>=767) { lcd.write(6); } else
 if (left[band]>=639) { lcd.write(5); } else
 if (left[band]>=511) { lcd.write(4); } else
 if (left[band]>=383) { lcd.write(3); } else
 if (left[band]>=255) { lcd.write(2); } else
 if (left[band]>=127) { lcd.write(1); } else
 if (left[band]>=0) { lcd.write(0); }
 }
 // display values of right channel on LCD
 for( band = 0; band < 7; band++ )
 {
 lcd.setCursor(band+9,0);
 if (right[band]>=895) { lcd.write(7); } else
 if (right[band]>=767) { lcd.write(6); } else
 if (right[band]>=639) { lcd.write(5); } else
 if (right[band]>=511) { lcd.write(4); } else
 if (right[band]>=383) { lcd.write(3); } else
 if (right[band]>=255) { lcd.write(2); } else
 if (right[band]>=127) { lcd.write(1); } else
 if (right[band]>=0) { lcd.write(0); }
 }
}
If you’ve been reading through my tutorials there isn’t anything new to worry about. And now for the demo, with sound -
That would look great on the side of a Walkman, however it’s a bit small. Let’s scale it up by using a Freetronics Dot Matrix Display - you may recall these from Clock One. For some background knowledge check the review here. Don’t forget to use a suitable power supply for the DMD – 5 V at 4 A will do nicely. The DMD contains 16 rows of 32 LEDs. This gives us twice the “resolution” to display each band level if desired. The display style is subjective, so for this example we’ll use a single column of LEDs for each frequency band, with a blank column between each one.
We use a lot of line-drawing statements to display the levels, and clear the DMD after each display. With this and the previous sketches, there could be room for efficiency – however I write these with the beginner in mind. Here’s the sketch:
// Example 48.3 - tronixstuff.com/tutorials > chapter 48 - 30 Jan 2013
// MSGEQ7 spectrum analyser shield with a Freetronics DMD
// for DMD
#include "DMD.h" // for DMD
#include "SPI.h" // SPI.h must be included as DMD is written by SPI (the IDE complains otherwise)
#include "TimerOne.h"
#include "SystemFont5x7.h" // keep next two lines if you want to add some text
#include "Arial_black_16.h"
DMD dmd(1, 1); // creates instance of DMD to refer to in sketch
void ScanDMD() // necessary interrupt handler for refresh scanning of DMD
{
 dmd.scanDisplayBySPI();
}
int strobe = 4; // strobe pins on digital 4
int res = 5; // reset pins on digital 5
int left[7]; // store band values in these arrays
int right[7];
int band;
void setup()
{
 // for DMD
 //initialize TimerOne's interrupt/CPU usage used to scan and refresh the display
 Timer1.initialize( 5000 ); //period in microseconds to call ScanDMD. Anything longer than 5000 (5ms) and you can see flicker.
 Timer1.attachInterrupt( ScanDMD ); //attach the Timer1 interrupt to ScanDMD which goes to dmd.scanDisplayBySPI()
 dmd.clearScreen( true ); //true is normal (all pixels off), false is negative (all pixels on)

 // for MSGEQ7
 pinMode(res, OUTPUT); // reset
 pinMode(strobe, OUTPUT); // strobe
 digitalWrite(res,LOW); // reset low
 digitalWrite(strobe,HIGH); //pin 5 is RESET on the shield
}
void readMSGEQ7()
// Function to read 7 band equalizers
{
 digitalWrite(res, HIGH);
 digitalWrite(res, LOW);
 for( band = 0; band < 7; band++ )
 {
 digitalWrite(strobe,LOW); // strobe pin on the shield - kicks the IC up to the next band
 delayMicroseconds(30); //
 left[band] = analogRead(0); // store left band reading
 right[band] = analogRead(1); // ... and the right
 digitalWrite(strobe,HIGH);
 }
}
void loop()
{
 int xpos;
 readMSGEQ7();
 dmd.clearScreen( true );
 // display values of left channel on DMD
 for( band = 0; band < 7; band++ )
 {
 xpos = (band*2)+1;
 if (left[band]>=895) { dmd.drawLine( xpos, 15, xpos, 1, GRAPHICS_NORMAL ); } else
 if (left[band]>=767) { dmd.drawLine( xpos, 15, xpos, 3, GRAPHICS_NORMAL ); } else
 if (left[band]>=639) { dmd.drawLine( xpos, 15, xpos, 5, GRAPHICS_NORMAL ); } else
 if (left[band]>=511) { dmd.drawLine( xpos, 15, xpos, 7, GRAPHICS_NORMAL ); } else
 if (left[band]>=383) { dmd.drawLine( xpos, 15, xpos, 9, GRAPHICS_NORMAL ); } else
 if (left[band]>=255) { dmd.drawLine( xpos, 15, xpos, 11, GRAPHICS_NORMAL ); } else
 if (left[band]>=127) { dmd.drawLine( xpos, 15, xpos, 13, GRAPHICS_NORMAL ); } else
 if (left[band]>=0) { dmd.drawLine( xpos, 15, xpos, 15, GRAPHICS_NORMAL ); }
 }

 // display values of right channel on DMD
 for( band = 0; band < 7; band++ )
 {
 xpos = (band*2)+18;
 if (right[band]>=895) { dmd.drawLine( xpos, 15, xpos, 1, GRAPHICS_NORMAL ); } else
 if (right[band]>=767) { dmd.drawLine( xpos, 15, xpos, 3, GRAPHICS_NORMAL ); } else
 if (right[band]>=639) { dmd.drawLine( xpos, 15, xpos, 5, GRAPHICS_NORMAL ); } else
 if (right[band]>=511) { dmd.drawLine( xpos, 15, xpos, 7, GRAPHICS_NORMAL ); } else
 if (right[band]>=383) { dmd.drawLine( xpos, 15, xpos, 9, GRAPHICS_NORMAL ); } else
 if (right[band]>=255) { dmd.drawLine( xpos, 15, xpos, 11, GRAPHICS_NORMAL ); } else
 if (right[band]>=127) { dmd.drawLine( xpos, 15, xpos, 13, GRAPHICS_NORMAL ); } else
 if (right[band]>=0) { dmd.drawLine( xpos, 15, xpos, 15, GRAPHICS_NORMAL ); }
 }
}
… and here it is in action:
Conclusion
At this point you have the knowledge to use the MSGEQ7 ICs to create some interesting spectrum analysers for entertainment and visual appeal – now you just choose the type of display enjoy the results.
Have fun and keep checking into tronixstuff.com. Why not follow things on twitter, Google+, subscribe for email updates or RSS using the links on the right-hand column, or join our Google Group – dedicated to the projects and related items on this website. Sign up – it’s free, helpful to each other – and we can all learn something.
Planet Arduino is, or at the moment is wishing to become, an aggregation of public weblogs from around the world written by people who develop, play, think on Arduino platform and his son. The opinions expressed in those weblogs and hence this aggregation are those of the original authors. Entries on this page are owned by their authors. We do not edit, endorse or vouch for the contents of individual posts. For more information about Arduino please visit www.arduino.cc
You are currently browsing the archives for the spectrum category.