Oct
28
28
FTDI all-in-one serial converter, programmer, switch
AuroraWatchNet, RaspberryPi Comments Off on FTDI all-in-one serial converter, programmer, switch
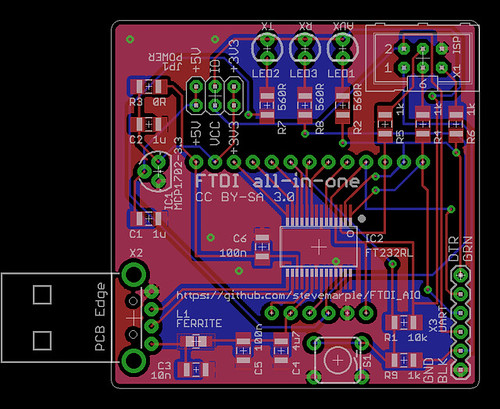 |
| FTDI all-in-one PCB layout. |
There are a multitude of FTDI converters and breakout boards available but none of them exactly fitted my needs so this is my version tuned to suit my requirements. I'm publishing the design files in the hope they are useful for others. Like the Sparkfun FTDI Basic Breakout and the Adafruit FTDI Friend it uses the FTDI FT232R but there are a number of differences, for instance it has a USB type A connector to plug directly into a USB host port.
Serial converter
The FTDI AIO provides a serial adaptor with the standard 6 pin FTDI pinout (TX, RX, CTS, DTR, VCC, and GND). A jumper block enables the VCC pin to be switched between +3.3V and +5V. A separate jumper enables the logic levels of the TX, RX, DTR and CTS signals to be set for +3.3V or +5V operation. The Sparkfun FTDI Basic Breakout can also be switched between +3.3V and +5V operation but does not allow for independent selection of VCC and the logic levels. This means when the Sparkfun FTDI Basic is set for +3.3V operation it's not compatible with the standard FTDI cables, which always supply +5V to the VCC pin. Whether that's a good thing or a bad thing depends on your needs; the FTDI AIO gives you both options.
AVR ISP programmer
Programming AVR microcontrollers, even with just a small bootloader, can be painfully slow and normally I'd use the AVR Dragon. There are situations however where it would be useful to have a low-cost USB programmer. A bit-banging AVR programmer is easily made and Adafruit has an excellent tutorial which explains how to do this.The FTDI all-in-one makes this convenient by providing the standard AVR ISP header. The defacto AVR standard is that the VCC pin is set to the same voltage as the logic-level signals. Unfortunately this practice isn't followed by +3.3V Arduino boards which always set VCC to +5V. For the widest compatibility the AVR ISP VCC pin can be set to either +3.3V or +5V with the logic levels of the !RESET, MISO, MOSI and SCK signals independently configured to either +3.3V or +5V.
On-board +3.3V voltage regulator
One of the features of the FT232R is that it has a built-in +3.3V regulator. This was used by older Arduinos to provide a +3.3V supply. However the current capability is limited to just 50mA which in many cases is not sufficient to power a microcontroller and all of its peripherals. The FTDI all-in-one can include an on-board voltage regulator with 250mA current output which should be sufficient to power an Arduino and several shields.
Auxiliary switch and LED
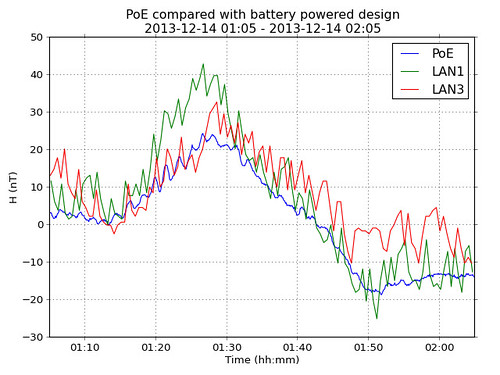
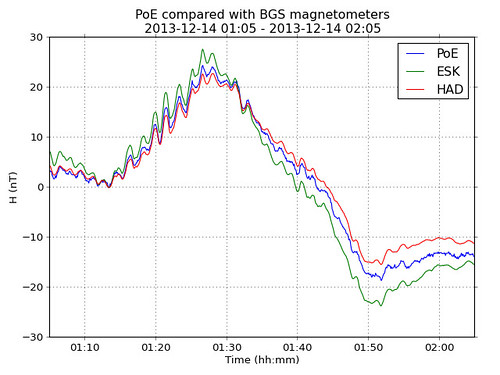
One of the key features I wanted was the ability to add an auxiliary switch and LED to the Raspberry Pi. Although the Pi has GPIO the AuroraWatchNet magnetometers normally have a radio fitted to this connector, which prevents it being easily used for other purposes. I worked around this by wiring a switch and LED to a Sparkfun FTDI Basic Breakout but I wanted a single PCB which plugged directly into one of the Pi's USB sockets.
Why would you want a switch? There are probably many uses. Mine is that I run one of the AuroraWatchNet magnetometers and I wanted a way to conveniently signal when I am going to cut the grass, or make some other magnetic disturbance in the garden.The data logging software, which runs on a Raspberry Pi, checks for the existence of a file which signals data quality might be bad. When the file is present data is logged to a separate set of files which aren't used by the AuroraWatch UK alerts system. While it's no bother for me to create the file by logging into the Pi I needed something simpler for other members of the family, so I wanted to wire up a switch. A separate daemon monitors the serial port to detect if the switch is pressed, if so the LED is turned on and the semaphore file created. If the switch is pressed again the file is removed and the LED turned off. The LED actually tracks the state of the file being present so it is possible to override the monitor process by creating or removing the semaphore file by other means.
Breakout board
All of the GPIO pins from the FTDI FT232R are conveniently broken out to pads spaced at 0.1" pitch. Also included are pads for the filtered +5V supply obtained from USB and +3.3V from the on-board regulator (if fitted, otherwise from the FT232R's built-in regulator).
Why use the FT232R?
Given the recent controversy regarding FTDI and Windows drivers you might wonder why I am using the FT232R instead of some other device. I'd probably prefer to use the Microchip MCP2200 USB UART converter for this application as it works well with my Calunium Arduino clone and it is available in a SOIC package which is easier to work with at home. Unfortunately its not possible to read the CTS line with the USB CDC driver which rules it out.
The PCB layout is not yet tested, although I did breadboard and test all of the functionality. I'll be sending the design off for manufacture in the next few days, it's likely I'll have a few boards spare.
Update: the first boards have been assembled and tested; all features work as planned. The bit-banging AVR ISP programmer is even slower than I feared, taking about 10 minutes to read the 4Kb EEPROM on the Atmel ATmega1284P on one of my Calunium boards.
Open-source hardware
The Eagle PCB design files are available on Github and are licensed under the Creative Commons Attribution-ShareAlike 3.0 (CC BY-SA 3.0) license.The PCB layout is not yet tested, although I did breadboard and test all of the functionality. I'll be sending the design off for manufacture in the next few days, it's likely I'll have a few boards spare.
Update: the first boards have been assembled and tested; all features work as planned. The bit-banging AVR ISP programmer is even slower than I feared, taking about 10 minutes to read the 4Kb EEPROM on the Atmel ATmega1284P on one of my Calunium boards.