Posts | Comments

Planet Arduino

Archive for the ‘Library’ Category

In the first part we looked at the HX711 hardware for implementing weigh scales systems.

This part will cover how software interacts with the hardware, requirements for a library and how to write a weigh scale application.

All the code described in this article can be found in my libraries code repository as the MD_HX711 library and examples.

Requirements

The most basic components of weighing machines a weight sensor, processing device and an interface (for example, these could be a load cell/HX711, a microprocessor and a display, respectively). They usually also have a method for taring the weight (eg, a switch). Other advanced features can be built into the device but they are refinements on the basics.

The simplest user interface for the scale is to continuously send to the interface the measured value. For a display output this would be just shown (like bathroom or kitchen scales) and/or it could be output through an external interface such as a serial port. Many industrial weight scales work exactly like this.

Therefore to implement a minimal weighing system we need a software framework, such as an Arduino library, that:

  1. Enables access to all the HX711 features (ie, both channels of data, resetting the device and Channel A gain selection).
  2. Can work in the background so that the application code implementing the weight scale functionality is free from dealing with hardware related operations. Preferably this works by either periodically polling the HX711 or by external interrupt.
  3. Allows the device to be tared and calibrated.
  4. As a minimum provides the readings from the device as raw, tared or calibrated values.

There are many HX711 libraries available and many provide lots of functions above the basics outlined above. However, I could not find one allowed easy access to Channel B or worked using an external interrupt. So I decided that it was time to write my own.

Library Implementation

Reading Device Data

The core of the library is a function used to implement the device communication protocol described in the previous post. The HX711ReadData() code is a straightforward sequential implementation of the CLK/DAT sequencing and timing required by the interface. The function returns the 24-bit DAC number received as a 32-bit integer.

int32_t MD_HX711::HX711ReadData(uint8_t mode)
// read data and set the mode for next read depending on what 
// options are selected in the library
{
  // local variables are faster for pins
  uint8_t clk = _pinClk;
  uint8_t data = _pinDat;

  // data read controls
  int32_t value = 0;
  uint32_t mask = 0x800000L;
    
  do   // Read data bits from the HX711
  {
    digitalWrite(clk, HIGH);

    delayMicroseconds(1);   // T2 typ 1us

    if (digitalRead(data) == HIGH) value |= mask;
    digitalWrite(clk, LOW); 

    delayMicroseconds(1);  // T3 typ 1us
    mask >>= 1;
  } while (mask > 0);

  // Set the mode for the next read (just keep clocking)
  do
  {
    digitalWrite(clk, HIGH);
    delayMicroseconds(1);
    digitalWrite(clk, LOW);
    delayMicroseconds(1);
    mode--;
  } while (mode > 0);

  return(value);
}

Note that the microsecond timing in this function is moot given that digitalWrite() and digitalRead() are quite slow compared to native processor register read/write.

HX711ReadData() is called from readNB() (read non-blocking), which puts the correct library context around the hardware call. This includes:

  • working out which channel we need to ask for in the next iteration.
  • setting the gain for the channel being requested.
  • managing the interrupt context.
  • saving the data received to the correct internal storage register.

The reason that we have a non-blocking read is that this method is designed to be called safely by an ISR for an external interrupt.

void MD_HX711::readNB(void)
// NON-Blocking read the data from the HX711 in an IRQ 
// safe manner.
{
  uint8_t extras = 0;
  int32_t value;

  _inISR = true;

  // set the next read channel
  if (_enableB) _nextReadA = !_nextReadA;

  // now work out how many extra clock cycles send when reading data
  if (!_nextReadA)            extras = 2; // Channel B gain 32
  else if (_mode == GAIN_128) extras = 1; // Channel A gain 128
  else                        extras = 3; // Channel B gain 64

  // do the read
  noInterrupts();
  value = HX711ReadData(extras);
  interrupts();

  // sign extend the returned data
  if (value & 0x800000) value |= 0xff000000;

  // save the data to the right index value
  channel_t ch = (_enableB && _nextReadA) ? CH_B : CH_A;
  _chanData[ch].raw = value;

  // increment the counter
  _readCounter++;

  _inISR = false;
}

The last received data for each channel is stored in library registers and can be retrieved using the getRaw(), getTared() and getCalibrated() methods, depending on what data the application needs.

Device Reset

The HX711 is reset by powering it down using the CLK pin held HIGH then back up again a very small time later.

inline void MD_HX711::powerDown(void)
// Set the CLK to low for at least 60us.
{
  digitalWrite(_pinClk, HIGH);
  delayMicroseconds(64);   // at least 60us HIGH
}

inline void MD_HX711::powerUp(void)
// set the CLK to high
{
  digitalWrite(_pinClk, LOW);
}

This resets the device into a default state, so the library implements a reset() method that does the same and keeps the library and device synchronized.

void MD_HX711::reset(void)
// set defaults and power cycle the hardware
{
  powerDown();
  powerUp();

  // set the library defaults
  enableChannelB(false);
  setGainA(GAIN_128);
  disableISR();
  _nextReadA = true;
  _readCounter = 0;
  for (uint8_t ch = 0; ch < NUM_CHAN; ch++)
  {
    _chanData[ch].raw = 0;
    _chanData[ch].tare = 0;
    _chanData[ch].calib = 0;
    _chanData[ch].range = 0.0;
  }
}

Tare and Calibration

The values returned from the hardware are 24-bit ADC values converting the amplified Wheatstone differential voltage to a number. This number must be calibrated to convert the value to a meaningful reading.

To calibrate the readings we first need to assume the Wheatstone bridge provides a linear response to the changes in weight (ie, there is a simple proportional relationship). This is the blue line in the figure. We know this assumption is not correct (see this article) but it is close enough if we choose the right load cell for the application.

The first part of calibration is to tare the readings with no force on the sensor (autoZeroTare() or setTare() methods). This provides the information to shift the ‘raw’ blue response curve to the green curve (line A0B0 shift to A1B1) by subtracting the tare ADC value. This locks in the zero point for the conversions and returned by the getTared() method.

The next part is to calibrate the actual slope of the conversion line – moving the green curve A1B1 to the red curve A1B2 in the diagram. This is done by applying a known force to the sensor (such as a known mass) and noting the ADC value returned (setCalibration()).

By setting the zero point and one known point, and assuming a linear response in the range of values being measured, the converted value y can be easily computed for any ADC value x using the getCalibrated() method.

Polled or External Interrupt?

The library supports both a polled and an interrupt driven approach to obtaining data from the HX711. Up to four separate HX711 devices on unique external interrupts are supported, using the technique described in this past post.

The enableInterruptMode() method is used by the application to toggle interrupt mode on/off as needed.

Polled Mode

This is the default operating mode for the library.

In polled mode the public read() method is synchronously invoked to wait for and obtain the next value from the hardware. If channel B is enabled the library will alternate reading channels (A, B, A, B, etc). The read() method returns the identifier of the channel last processed and the data is retrieved with getRaw(), getTared() and getCalibrated(), as required.

As the read() method is synchronous (it blocks waiting for the next data to be available read from the hardware) the isReady() method can be used to determine if there is data ready for processing. This allows an application to check before calling read() to avoid unnecessary application delays caused by the library.

Interrupt Mode

In interrupt mode the library will process data received from the HX711 in the background, based on an interrupt generated by the device DAT signal going low.

Interrupt mode requires that the I/O pin connected to the DAT signal supports external interrupts (eg, for an Arduino Uno this would be pins 2 or 3).

The application can monitor the getReadCount() method to determine when new data has been received. In interrupt mode the read() method becomes non-blocking and returns the id of the channel whose data was the last received so that it can be read with getRaw(), getTared() and getCalibrated().

Prototyping Weigh Scales

Once the basic hardware related functions of the library were coded and broadly tested, it was time to prototype a weight scale to complete the weigh scale code.

Hardware

I was testing with a 1kg bar-type load cell, so a small scale was adequate. A 100mm diameter top and a bottom plate were modelled in Fusion360, shown below, and 3D printed in ABS.

The top plate is a solid disc. The bottom is more open to save material and give access to the screws for joining the top plate and load cell. Both plates include a small pad to lift the load cell so that it is cantilevered it between the two plates. Machine screws (M4) connect all the components together.

Additional hardware required for this prototype was:

  • A 2 line by 20 character LCD module. In this instance it used an I2C interface to the processor, but any other size module and interface that works with LiquidCrystal (or clones) library will work.
  • A tact switch to tare and calibrate the scale.

The final configuration is shown in the photo above, along with a few of the objects used to test the scale and my 1kg bag of rice used to for calibration.

Software

As the library does most of the heavy lifting, the application software becomes straighforward.

The software described here is the MD_HX711_WeighScale example from the library.

This example implements a weigh scale that

  • Can be tared and calibrated using a tact single switch. A Single press of the switch sets the tare, double press sets the calibration to 1000g.
  • Tare and calibration settings are stored in EEPROM and loaded at startup.
  • Updates the LCD display with the current weight as soon as a new weight is available.
  • Demonstrates receiving data from the HX711 in either polled or interrupt driven mode, set by a #define at compile time.

Configuration Parameters are loaded at startup. The EEPROM data includes two signature bytes so that the software can detect a ‘first time’ run and initialize the data to sensible defaults. All changes to configuration values are immediately and transparently saved to EEPROM.

The tact switch is managed by the MD_UISwitch library (also described in this previous post). This allows the application to test for either a press/double press in the main loop() and do the necessary for each case.

Taring is done to set the scale ‘zero’ by a simple pressing of the tact switch. This is usually when the sale is empty by could equally be when the scale has a container on it.

Calibration is carried out by putting a known 1000g weight (my not-very-accurate bag of rice) on the scale and double pressing the switch.

This application needs to be non-blocking for the user switch to work properly. In this case it turns out there is minimal difference to the application’s structure between interrupt and polled modes. In polled mode it monitors isReady() before calling read() to read the data; in interrupt mode it checks getReadCount() to know when new data is available.

One wrinkle is that when the weight is zero, ADC noise fluctuation around the zero point causes the scale to display 0.0 and -0.0. To prevent what looks like a flickering minus sign, the application calculates and displays a ‘damped’ weight calculated as

float dampedWeight(float newReading)
// Dampen the fluctuations in readings value and make any small // negative values 0.0
{
  const float PORTION = 0.80;
  static float lastReading = 0.0;

  // dampen
  lastReading += PORTION * (newReading - lastReading);

  // kill small negative values
  if (lastReading < 0.0 && lastReading > -0.1)
    lastReading = 0.0;

  return(lastReading);
}

If a weight is negative by less that the least significant figure (ie between 0.0 and -0.1) then we can display it as zero. This completely eliminates the visual distraction of the ‘flickering’ minus.

Additionally, this function also dampens the changes to the displayed weight by only adding in PORTION (80%) of the change between the current and last reading. This dampens the ADC noise but also has the side effect of a pleasing ‘converging value’ animation on the weighscale display.

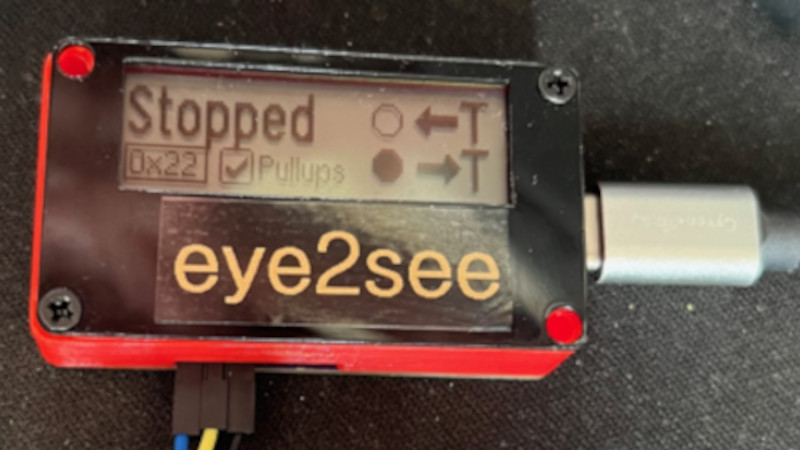
For as popular as the Arduino platform is, it’s not without its problems. Among those is the fact that most practical debugging is often done by placing various print statements throughout the code and watching for them in the serial monitor. There’s not really a great way of placing breakpoints or stepping through code, either. But this project, known as eye2see, hopes to change that by using the i2c bus found in most Arduinos to provide a more robust set of debugging tools.

The eye2see software is set up to run on an Arduino or other compatible microcontroller, called the “probe”, which is connected to the i2c bus on another Arduino whose code needs to be debugged. Code running on this Arduino, which is part of the eye2see library, allows it to send debugging information to the eye2see probe. With a screen, the probe can act as a much more powerful debugger than would otherwise typically be available, being able to keep track of variables in the main program, setting up breakpoints, and outputting various messages on its screen.

The tool is not without its downsides, though. The library that needs to run on the host Arduino slows down the original program significantly. But for more complex programs, the tradeoff with powerful debugging tools may be worth it until these pieces of code can be removed and the program allowed to run unencumbered. If you’d like to skip needing to use a second Arduino, we’ve seen some other tools available for debugging Arduino code that can run straight from a connected PC instead.

Analog panel meters (APM) are instruments that measure and display variables on a dial, usually with a moving pointer or needle in front of a proportional scale.

I wanted to try using these meters in a clock project but have been put off by their high unit cost. However, a recent ‘fire sale’ at a local electronics wholesaler provided the opportunity to acquire 10 meters for just a few cents each, so this project became feasible.

All the files and software for this project are available online at my code repository.

The concept for this clock is to display the clock’s date and time elements on a number of separate meters, each driven by the voltage produced by the microcontroller analog output.

Analog Panel Meters

Panel meters are simple electromechanical devices that can be used to measure currents, voltages, and resistances.

The basic part of any meter is the movement (a moving coil with associate mechanical pivots and adjusters). The movement moves the needle over the calibrated range to indicate the quantity being measured.

The coil works as a simple electromagnet – if you apply a voltage to the coil and a current flows through it, it magnetizes its iron core and creates a magnetic field that moves the pointer in proportion to the voltage applied. A spring holds tension on the movement to balance the electromagnetic force and return it to the zero position when no voltage is applied.

A good video of how meters work can be found here.

The panels meters I purchased (Jaycar QP5020) are designed to measure a full-scale deflection of 20V DC, but the maximum analog output from the microcontroller is 5V, so something needed to be modified.

Meter Recalibration

Most panel meters are just a raw movement, with a certain sensitivity, often written on the lower portion of the scale. Typical wording would be “10 mA FS” to indicate that the meter needs a 10mA current through it for full scale deflection. This full scale current usually has no relation to the indicator scale markings.

To recalibrate the meter you need to adapt the resistance of the driving circuitry to achieve the full scale current of the panel meter with the new driving voltage. You can see in the photo below that, for the volt meter used in this project, there was an internal resistor in series with the + terminal used to calibrate the meter.

Panel Meter Internals

For the as-purchased full scale range (1mA from the meter specs), the 20V reading was achieved with a 20kΩ resistor in series with the measured voltage. By Ohms Law (I=V/R) this gives a full scale current of (20V/20kΩ) = 1mA. So, reversing the calculation, to show a full scale voltage of 5V – the maximum Arduino analog output – we need to replace the resistor with a (5V/1mA) = 5kΩ resistor.

Changing Meter’s Faceplate

Once the range is changed the original panel meter indicator scale becomes obsolete, so it needs a new faceplate. In any case I wanted to show time and date values, not voltages, so I went searching for software that could help with this task.

Original Faceplate

I found 2 commonly referenced/recommended specialist tools that run under Microsoft Windows:

  • Meter (link here) has a paid and free version. The free MeterBasic (a cut down version of the paid version) is sufficient for a hobbyist who needs to generate the occasional simple scale. It is based on a subset of the features found in Meter and has no time or usage limitations. The design of the scale/faceplate is based on input entered into fixed parameter fields, with a draft displayed in the application window before printing it out.
  • Galva (link here) is a free program that was specifically designed to draw precise dials for galvanometers, potentiometer, CVs, and other dial-type devices, although it is now more general. It can draw scales with all kinds of shapes (curved or straight) and graduations (linear, functions of a power, logarithmic, specific, manual, etc.). Scales are produced using a scripting language with an on-screen graphical preview before printing.

After experimenting with both I decided to use Galva. The learning curve was much steeper but it seemed to be more flexible and the output looker cleaner on my printer. The script used to produce the scales shown below is included within in the project sketch source folders.

New Faceplate

MCU Analog Output

On thing to note is that the MCU ‘analog’ output is really a PWM output, which means that the meter is not measuring a constant voltage but an oscillating square wave.

I ran some tests with the meters used in this project and they did not seem to be affected by this (ie, setting the voltage to a known value showed the approriate proportional movement of the meter dial). However, this may not be the case for other meters and will need to be determined on a case by case basis. The solution would be to smooth out the voltage with a capacitor – lots on material on the internet for this.

It is also worth noting that USB power supplies are not usually exactly 5V and therefore the MCU output cannot be exact, creating errors in the full scale deflection of the meter. There are a couple of easy solutions for this:

  1. Ensure that the voltage is correct. My experience is that a USB power supply is usually just under 5V, so this is the option I used. By adding by adding in a step-up buck converter at the USB power input to the clock, I ensure that the voltage remains at exactly 5V for ll the clock circuits. This makes the internal voltage independent of the supply voltage as long as it is 5V or less. If your usual supply is greater that 5V then a step-down buck converter could be used to the same effect.
  2. Match the internal resistance to the expected voltage (eg, use an adjustable variable resistor instead of a fixed value). This works well for an arbitrary voltage but only for that specific voltage. Should the voltage fluctuate it will stop working and need readjusting.

System Hardware

Once I was sure that the concept was valid, it was time to consider the system architecture.

System Block Diagram

The clock is powered through a USB power-only socket. A step-up voltage converter is used to maintain the calibrated, accurate, constant 5V for the clock circuits.

The RTC time clock is a DS3231 module with an I²C interface. The APM displays month, date, day of week, hours and minutes on the meter dials APM1 through APM55.

Finally, two momentarily-on switches (for Mode and Set) are used for setting and displaying the time.

The hardware was prototyped using my existing prototyping modules (see this previous blog post) modules and an Arduino Uno, shown below.

APM Clock prototype

Clock Case

Front Panel and Enclosure

For this project the case is made from three parts – a perspex front panel, plywood sides and a removable plywood back.

The perspex front panel was drawn in Fusion360 to produce a 1:1 paper template that allowed me to easily drill out the holes for the APMs. This does not need to be too neat as the holes are hidden behind the APM faces and the outside edges are covered by the enclosure face frame when installed.

The inside of the transparent perspex panel was sanded and spray painted black to produce the effect shown in the photos below.

The sides are a simple 12mm plywood box with a mitred face frame. The perspex panel was butted to the inside of the face frame and fixed in place with a bead of hot glue around the inside edge join in the box.

The back (not shown) is 3mm plywood attached with M3 machine screws into threaded inserts installed on the edge of the plywood box. The back has a cut out to install the USB connector and two tact switches.

Switches and Power Connection

A 3D printed part was produced as a scaffold for the USB connector and Mode/Set switches. This was modelled in Fusion 360, shown below.

The 3D model for this is included in the project files.

Software

To simplify software implementation I used my MD_DS3231 and MD_UISWitch libraries to manage the DS3231 RTC and the switches using the Arduino Pro Mini.

The software for this project is available from my code repository. Essentially it does 4 things:

  1. Periodically update the display. Checks every second and updates when the minutes change.
  2. Manage time setup progression when the mode switch is pressed.
  3. Manage Summer Time offset when the mode switch is long pressed.
  4. Display full range on all APM when the Set switch is pressed.

Display Update

The clock does not show seconds, so the minimum time resolution is 1 minute. The RTC is checked and the display updated every second by counting elapsed milliseconds.

Time Setup

The actual time needs to be input at the start and, from time to time, may need adjusting.

Adjusting the time is started by pressing the Mode switch to move between each APM, the Set switch to increment the value displayed, with roll-around, and the the Mode switch to move on to the next value to be changed. To show which APM is being the ‘current’ value being changed, all the other meter displays are set to zero.

Displays are updated in the order month, date, day of week, hour and minute. As this clock has a 12 hour dial, while the hours are being edited the minute display will move to zero if the hours are in the morning (AM) and move to full scale when the hours are PM.

P:ressing Mode after the last value (minutes) is set will set the time. A one minute inactivity timeout prevents the display from remaining in edit mode indefinitely – the time setting process is aborted and the new time is not set.

Summer Time Offset

Rather than go through the process of setting a new time the Summer Time period, a long press of the mode switch will set up an automatic +1 hour display offset to the RTC time. Summer Time offset is reset to +0 by another long press. The current Summer Time mode is stored in EEPROM and will be retained between power cycles.

Full Range Check

It is useful to occasionally check the full range is accurate. While the clock is displaying the time, pressing the Set switch moves the APM needles to full scale. Releasing the Set switch puts the clock back in normal display mode.

Putting it all together

Once the meters were installed in the enclosure, a ground wire was connected to all the – terminals and a lead to all the + terminals.

The USB and switch module was hot glued to the back panel. The hot glue was also spread over the switch connections to provide some mechanical stability for the wires.

The USB connector and the switch were added to the back panel and wired in. Hot glue was again used to lock the USB socket in place and reinforce the wire connections on the back.

All wires were then soldered to the Pro Mini and it, and the clock module, were hot glued to the base of the enclosure.

The entire was then unit tested before finally closing the case and putting the new clock on the shelf in my office.

Analog panel meters (APM) are instruments that measure and display variables on a dial, usually with a moving pointer or needle in front of a proportional scale.

I wanted to try using these meters in a clock project but have been put off by their high unit cost. However, a recent ‘fire sale’ at a local electronics wholesaler provided the opportunity to acquire 10 meters for just a few cents each, so this project became feasible.

All the files and software for this project are available online at my code repository.

The concept for this clock is to display the clock’s date and time elements on a number of separate meters, each driven by the voltage produced by the microcontroller analog output.

Analog Panel Meters

Panel meters are simple electromechanical devices that can be used to measure currents, voltages, and resistances.

The basic part of any meter is the movement (a moving coil with associate mechanical pivots and adjusters). The movement moves the needle over the calibrated range to indicate the quantity being measured.

The coil works as a simple electromagnet – if you apply a voltage to the coil and a current flows through it, it magnetizes its iron core and creates a magnetic field that moves the pointer in proportion to the voltage applied. A spring holds tension on the movement to balance the electromagnetic force and return it to the zero position when no voltage is applied.

A good video of how meters work can be found here.

The panels meters I purchased (Jaycar QP5020) are designed to measure a full-scale deflection of 20V DC, but the maximum analog output from the microcontroller is 5V, so something needed to be modified.

Meter Recalibration

Most panel meters are just a raw movement, with a certain sensitivity, often written on the lower portion of the scale. Typical wording would be “10 mA FS” to indicate that the meter needs a 10mA current through it for full scale deflection. This full scale current usually has no relation to the indicator scale markings.

To recalibrate the meter you need to adapt the resistance of the driving circuitry to achieve the full scale current of the panel meter with the new driving voltage. You can see in the photo below that, for the volt meter used in this project, there was an internal resistor in series with the + terminal used to calibrate the meter.

Panel Meter Internals

For the as-purchased full scale range (1mA from the meter specs), the 20V reading was achieved with a 20kΩ resistor in series with the measured voltage. By Ohms Law (I=V/R) this gives a full scale current of (20V/20kΩ) = 1mA. So, reversing the calculation, to show a full scale voltage of 5V – the maximum Arduino analog output – we need to replace the resistor with a (5V/1mA) = 5kΩ resistor.

Changing Meter’s Faceplate

Once the range is changed the original panel meter indicator scale becomes obsolete, so it needs a new faceplate. In any case I wanted to show time and date values, not voltages, so I went searching for software that could help with this task.

Original Faceplate

I found 2 commonly referenced/recommended specialist tools that run under Microsoft Windows:

  • Meter (link here) has a paid and free version. The free MeterBasic (a cut down version of the paid version) is sufficient for a hobbyist who needs to generate the occasional simple scale. It is based on a subset of the features found in Meter and has no time or usage limitations. The design of the scale/faceplate is based on input entered into fixed parameter fields, with a draft displayed in the application window before printing it out.
  • Galva (link here) is a free program that was specifically designed to draw precise dials for galvanometers, potentiometer, CVs, and other dial-type devices, although it is now more general. It can draw scales with all kinds of shapes (curved or straight) and graduations (linear, functions of a power, logarithmic, specific, manual, etc.). Scales are produced using a scripting language with an on-screen graphical preview before printing.

After experimenting with both I decided to use Galva. The learning curve was much steeper but it seemed to be more flexible and the output looker cleaner on my printer. The script used to produce the scales shown below is included within in the project sketch source folders.

New Faceplate

MCU Analog Output

On thing to note is that the MCU ‘analog’ output is really a PWM output, which means that the meter is not measuring a constant voltage but an oscillating square wave.

I ran some tests with the meters used in this project and they did not seem to be affected by this (ie, setting the voltage to a known value showed the approriate proportional movement of the meter dial). However, this may not be the case for other meters and will need to be determined on a case by case basis. The solution would be to smooth out the voltage with a capacitor – lots on material on the internet for this.

It is also worth noting that USB power supplies are not usually exactly 5V and therefore the MCU output cannot be exact, creating errors in the full scale deflection of the meter. There are a couple of easy solutions for this:

  1. Ensure that the voltage is correct. My experience is that a USB power supply is usually just under 5V, so this is the option I used. By adding by adding in a step-up buck converter at the USB power input to the clock, I ensure that the voltage remains at exactly 5V for ll the clock circuits. This makes the internal voltage independent of the supply voltage as long as it is 5V or less. If your usual supply is greater that 5V then a step-down buck converter could be used to the same effect.
  2. Match the internal resistance to the expected voltage (eg, use an adjustable variable resistor instead of a fixed value). This works well for an arbitrary voltage but only for that specific voltage. Should the voltage fluctuate it will stop working and need readjusting.

System Hardware

Once I was sure that the concept was valid, it was time to consider the system architecture.

System Block Diagram

The clock is powered through a USB power-only socket. A step-up voltage converter is used to maintain the calibrated, accurate, constant 5V for the clock circuits.

The RTC time clock is a DS3231 module with an I²C interface. The APM displays month, date, day of week, hours and minutes on the meter dials APM1 through APM55.

Finally, two momentarily-on switches (for Mode and Set) are used for setting and displaying the time.

The hardware was prototyped using my existing prototyping modules (see this previous blog post) modules and an Arduino Uno, shown below.

APM Clock prototype

Clock Case

Front Panel and Enclosure

For this project the case is made from three parts – a perspex front panel, plywood sides and a removable plywood back.

The perspex front panel was drawn in Fusion360 to produce a 1:1 paper template that allowed me to easily drill out the holes for the APMs. This does not need to be too neat as the holes are hidden behind the APM faces and the outside edges are covered by the enclosure face frame when installed.

The inside of the transparent perspex panel was sanded and spray painted black to produce the effect shown in the photos below.

The sides are a simple 12mm plywood box with a mitred face frame. The perspex panel was butted to the inside of the face frame and fixed in place with a bead of hot glue around the inside edge join in the box.

The back (not shown) is 3mm plywood attached with M3 machine screws into threaded inserts installed on the edge of the plywood box. The back has a cut out to install the USB connector and two tact switches.

Switches and Power Connection

A 3D printed part was produced as a scaffold for the USB connector and Mode/Set switches. This was modelled in Fusion 360, shown below.

The 3D model for this is included in the project files.

Software

To simplify software implementation I used my MD_DS3231 and MD_UISWitch libraries to manage the DS3231 RTC and the switches using the Arduino Pro Mini.

The software for this project is available from my code repository. Essentially it does 4 things:

  1. Periodically update the display. Checks every second and updates when the minutes change.
  2. Manage time setup progression when the mode switch is pressed.
  3. Manage Summer Time offset when the mode switch is long pressed.
  4. Display full range on all APM when the Set switch is pressed.

Display Update

The clock does not show seconds, so the minimum time resolution is 1 minute. The RTC is checked and the display updated every second by counting elapsed milliseconds.

Time Setup

The actual time needs to be input at the start and, from time to time, may need adjusting.

Adjusting the time is started by pressing the Mode switch to move between each APM, the Set switch to increment the value displayed, with roll-around, and the the Mode switch to move on to the next value to be changed. To show which APM is being the ‘current’ value being changed, all the other meter displays are set to zero.

Displays are updated in the order month, date, day of week, hour and minute. As this clock has a 12 hour dial, while the hours are being edited the minute display will move to zero if the hours are in the morning (AM) and move to full scale when the hours are PM.

P:ressing Mode after the last value (minutes) is set will set the time. A one minute inactivity timeout prevents the display from remaining in edit mode indefinitely – the time setting process is aborted and the new time is not set.

Summer Time Offset

Rather than go through the process of setting a new time the Summer Time period, a long press of the mode switch will set up an automatic +1 hour display offset to the RTC time. Summer Time offset is reset to +0 by another long press. The current Summer Time mode is stored in EEPROM and will be retained between power cycles.

Full Range Check

It is useful to occasionally check the full range is accurate. While the clock is displaying the time, pressing the Set switch moves the APM needles to full scale. Releasing the Set switch puts the clock back in normal display mode.

Putting it all together

Once the meters were installed in the enclosure, a ground wire was connected to all the – terminals and a lead to all the + terminals.

The USB and switch module was hot glued to the back panel. The hot glue was also spread over the switch connections to provide some mechanical stability for the wires.

The USB connector and the switch were added to the back panel and wired in. Hot glue was again used to lock the USB socket in place and reinforce the wire connections on the back.

All wires were then soldered to the Pro Mini and it, and the clock module, were hot glued to the base of the enclosure.

The entire was then unit tested before finally closing the case and putting the new clock on the shelf in my office.

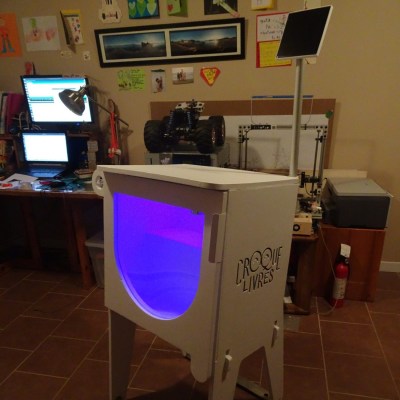
Reading is big in Québec, and [pepelepoisson]’s young children have access to a free mini library nook that had seen better days and was in dire need of maintenance and refurbishing. In the process of repairing and repainting the little outdoor book nook, he took the opportunity to install a few experimental upgrades (link in French, English translation here.)

The mini library pods are called Croque-Livres, part of a program of free little book nooks for children across Québec (the name is a bit tricky to translate into English, but think of it as “snack shack, but for books” because books are things to be happily devoured.)

After sanding and repairs and a few coats of new paint, the Croque-Livres was enhanced with a strip of WS2812B LEDs, rechargeable battery with solar panel, magnet and reed switch as door sensor, and a 3.3 V Arduino to drive it all. [pepelepoisson]’s GitHub repository for the project contains the code and CAD files for the 3D printed pieces.

The WS2812B LED strip technically requires 5 V, but as [pepelepoisson] found in his earlier project Stecchino, the LED strip works fine when driven directly from a 3.7 V lithium-polymer cell. It’s not until around 3 V that it starts to get unreliable, so a single 3.7 V cell powers everything nicely.

When the door is opened, the LED strip lights up with a brief animation, then displays the battery voltage as a bar graph. After that, the number of times the door as been opened is shown on the LED strip in binary. It’s highly visual, interactive, and there’s even a small cheat sheet explaining how binary works for anyone interested in translating the light pattern into a number. How well does it all hold up? So far so good, but it’s an experiment that doesn’t interfere at all with the operation of the little box, so it’s all good fun.

There was a time when having a blinking blue LED on a project was all you needed to be one of the cool kids. But now you need something more complex. LEDs should not just snap on, they should fade in and out. And blinking? Today’s hotness is breathing LEDs. If that’s the kind of project you want, you should check out [jandelgado’s] jled library.

At first glance, an Arduino library for LED control might seem superfluous, but if you are interested in nice effects, the coding for them can be a bit onerous. If you don’t mind stopping everything while you fade an LED on (or off) then sure, you just write a loop and it is a few lines of code. But if you want to have it happen while other things continue to execute, it is a little different. The library makes it very simple and it is also nicely documented.

Obviously, to create a special effect LED, you need to create a JLed object. Then you can use modifier methods on that object to get certain effects. The only overhead is that you need to call the update method on the LED periodically. Here is one of the examples from the project:

#include <jled.h>

// connect LED to pin 13 (PWM capable). LED will breathe with period of
// 2000ms and a delay of 1000ms after each period.
JLed led = JLed(13).Breathe(2000).DelayAfter(1000).Forever();

void setup() { }

void loop() {
   led.Update();
}

Pretty easy and readable. Just remember that some Arduinos can’t do PWM on pin 13, so you might have to adjust. Our only complaint is that you have to update each LED. It would be nice if the JLed constructor kept a linked list of all LED objects so you could have a class method that updates all of them with one call. In the examples, the author keeps all the LEDs in an array and steps through that. However, that would be easy to fork and add. Oh wait, we did it for you. The library does do a lot of work, including taking advantage of higher PWM resolution available on the ESP8266, for example.

The library can turn an LED on or off (including delays), blink or breathe an LED forever or for a certain number of times, or fade an LED on or off. In addition to the presets, you can provide your own brightness function if you want to do some kind of custom pattern. You can modify most actions by specifying a delay before or after, a repeat count (which can be forever) and you can also tell the library that your LED is active low, so you don’t have to mentally remember to flip everything around in your code.

Rocket science? No. But we like it. Blocking for an LED effect is bad and this makes fancy asynchronous LEDs simple. Why not use it? Recent IDEs can install it from the manage library dialog, so it takes just a second.

Really, libraries are a key to building systems simple. Why not stand on the backs of others? Some of our favorites handle SPI and proportional integral derivative (PID) control.

The WS2812 is an amazing piece of technology. 30 years ago, high brightness LEDs didn’t even exist yet. Now, you can score RGB LEDs that even take all the hard work out of controlling and addressing them! But as ever, we can do better.

Riffing on the ever popular Adafruit NeoPixel library, [Harm] created the WS2812FX library. The library has a whole laundry list of effects to run on your blinkenlights – from the exciting Hyper Sparkle to the calming Breathe inspired by Apple devices. The fantastic thing about this library is that it can greatly shorten development time of your garden-variety blinkables – hook up your WS2812s, pick your effect, and you’re done.

[Harm]’s gone and done the hard yards, porting this to a bevy of platforms – testing it on the Arduino Nano, Uno, Micro and ESP8266. As a proof of concept, they’ve also put together a great demonstration of the software – building some cute and stylish Christmas decorations from wood, aluminium, and hacked up Christmas light housings. Combining it with an ESP8266 & an app, the effects can be controlled from a smartphone over WiFi. The assembly video on YouTube shows the build process, using screws and nails to create an attractive frame using aluminium sheet.

This project is a great example of how libraries and modern hardware allow us to stand on the shoulders of giants. It’s quicker than ever to build amazingly capable projects with more LEDs than ever. Over the years we’ve seen plenty great WS2812 projects, like this sunrise alarm clock or this portable rave staff.
As always, blink hard, or go home. Video after the break.


Filed under: Arduino Hacks, Holiday Hacks, led hacks

mechbox

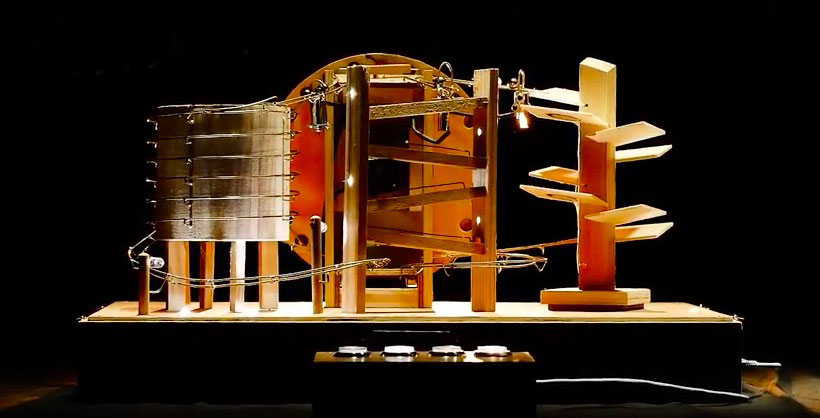
Les Boites Mécaniques are a set of four automated boxes that produce music out of wood and metal. These experimental instruments enable anyone to explore the magic of making sound by pressing buttons on a remote, which activate each respective device to vibrate, knock, and rub materials.

The boxes were developed by Kogumi‘s Anatole Buttin and Yan Godat for educational electronic music workshops, and can be played either solo or in unison. There’s even a mode that allows users to control it all via MIDI notes on a computer.

In terms of hardware, each box is equipped with an Arduino Uno, a TLC59711 LED driver, step motors with AccelStepper library and a 3D-printed microstep driver.

Watch the video below to see how it all comes together to create a unique sound!

plant-data

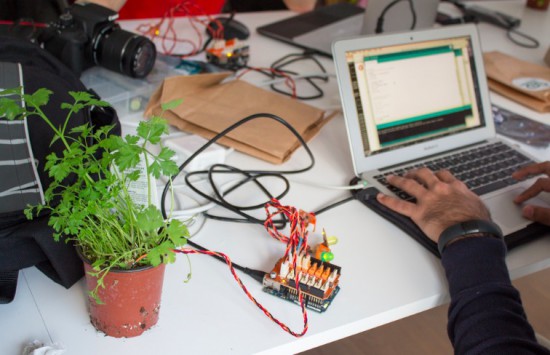
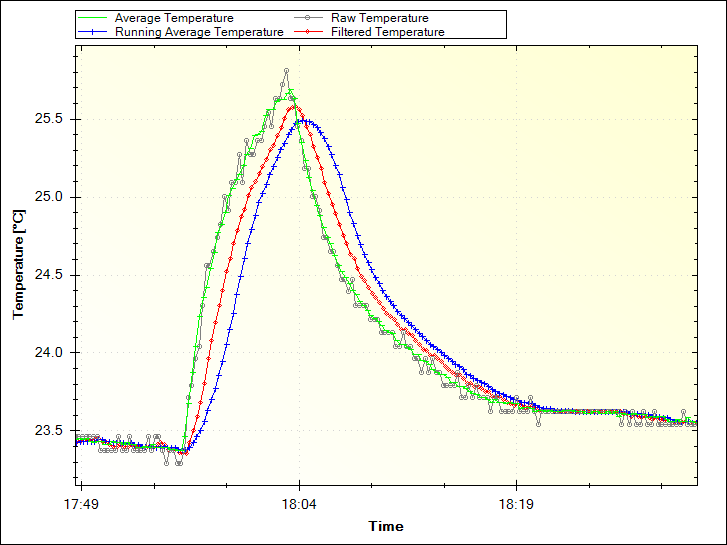
Increasing accuracy in the collection of data coming from sensors is a need that, sooner or later, Makers need to face. Paul Martinsen from MegunoLink created a tutorial to eliminate noise from sensor readings on Arduino with three simple filtering techniques.

The Averaging and Running Average techniques are easy to implement as they work by adding a number of measurements together, then dividing the total by the number of measurements. In both cases, the downside is that it can use a lot of memory.

The Exponential filter is a better solution for several reasons: it doesn’t require much memory, you can control how much filtering is applied with a single parameter, and it saves battery power because you don’t need to make many measurements at once. For this solution, they developed an Arduino filter library so you don’t need to go mad with math!

Filtering

Interested? You can find the tutorial and explore the code on MegunoLing’s blog post here.

We’re still not sure exactly how [connornishijima]’s motion detector works, though many readers offered plausible explanations in the comments the last time we covered it. It works well enough, though, and he’s gone and doubled down on the Arduino way and bundled it up nicely into a library.

In the previous article we covered [connor] demonstrating the motion detector. Something about the way the ADC circuit for the Arduino is wired up makes it work. The least likely theory so far involves life force, or more specifically, the Force… from Star Wars. The most likely theories are arguing between capacitance and electrostatic charge.

Either way, it was reliable enough a phenomenon that he put the promised time in and wrote a library. There’s even documentation on the GitHub. To initialize the library simply tell it which analog pin is hooked up, what the local AC frequency is (so its noise can be filtered out), and a final value that tells the Arduino how long to average values before reporting an event.

It seems to work well and might be fun to play with or wow the younger hackers in your life with your wizarding magics.


Filed under: Arduino Hacks


  • Newsletter

    Sign up for the PlanetArduino Newsletter, which delivers the most popular articles via e-mail to your inbox every week. Just fill in the information below and submit.

  • Like Us on Facebook