Mar
25
25
Power over ethernet (PoE) magnetometer and cloud detector
arduino, AuroraWatch UK, AuroraWatchNet, Calunium, cloud detector, Magnetometer Comments Off on Power over ethernet (PoE) magnetometer and cloud detector
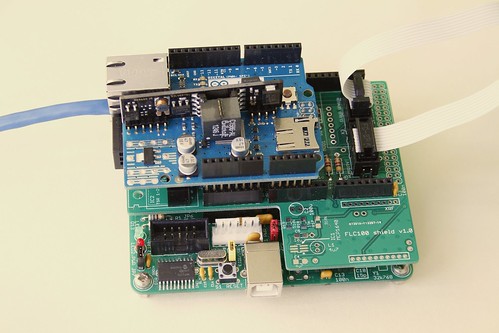 |
| Combined magnetometer and cloud detector. |
To improve the performance and stability of the AuroraWatchNet magnetometers I recently began experimenting with a power over ethernet (PoE) version. With restrictions on power consumption lifted considerable performance improvements are possible. As a result I have developed the magnetometer hardware specifically to support a power over ethernet version. Another instrument I've been developing is a cloud detector. This too should benefit from a power over ethernet version. One problem I encountered was with dew settling on the sensor but fitting a heater is incompatible with battery-powered operation. Since both the magnetometer and cloud detector use almost the same hardware I decided to design an Arduino-compatible 'shield' that could be used to support both systems.
The complete system requires six circuit boards (five for the wireless version). The first is the microcontroller board, I use my Calunium Arduino clone. I hope that in future it will be possible to use an off-the-shelf Arduino Mega2560 instead but the current firmware relies on Calunium's real-time clock to generate the hardware interrupts which control the sampling interval. There is also a sensor shield, the Arduino Ethernet shield (omitted on the battery-powered wireless version), and one board for each of the sensors (fluxgate magnetometer, IR temperature and humidity).
The sensor shield is based on the existing design and retains the option of battery-powered operation with radio communication. The magnetometer sensor and analogue-to-digital converter must be powered at 5V, which requires a level-shifting circuit when the microcontroller is powered from 3.3V, which is the case when operating from batteries. For power over ethernet use the microcontroller must also operate at 5V for compatibility with the Arduino Ethernet shield so the level shifting is not required. It is kept however as it provides buffering between the two circuit boards; 1.5m is a considerable distance for an I2C bus. The cloud detector uses a non-contact infra-red temperature sensor operating at 3.3V so a level-shifting circuit is required for PoE operation where the microcontroller is connected to 5V. (I've ignored the fact that a 5V version of the sensor exists since it isn't readily available in the UK). The sensor shield allows a humidity sensor to be connected so that estimates of the clear sky and cloudy sky temperatures can be made. As before, an on-board LM61 temperature sensor monitors the system temperature. The new sensor shield also adds a header to fit an Embedded Adventures lightning sensor module. I don't have one of these at the moment so I can't be certain it will work and there is no software support for it in the existing firmware. Fitting it at the same time as the cloud detector sensors will require long break-away headers to be soldered to the bottom of the lightning sensor module.
The fluxgate sensor is fitted on its own PCB which contains the analogue to digital converter. For PoE operation a linear voltage regulator is used to convert from 9V to the 5V supply it requires. For battery operation a MAX619 DC-DC charge pump boosts the battery voltage to 5V. Almost all of the temperature variation can be removed by placing the PCB at the bottom of a 1m length of soil pipe. The pipe is buried to a depth of 0.85m with its axis vertical. In the magnetometer-only system the microcontroller, sensor shield and ethernet shield (or batteries for the wireless version) are fitted onto a wooden frame to hold them into the top part of the tube. Positioning the rest of the system away from the fluxgate sensor helps to avoid unwanted effects from any ferro-magnetic components (such as the batteries), it also aids access and enables wireless data transmission.
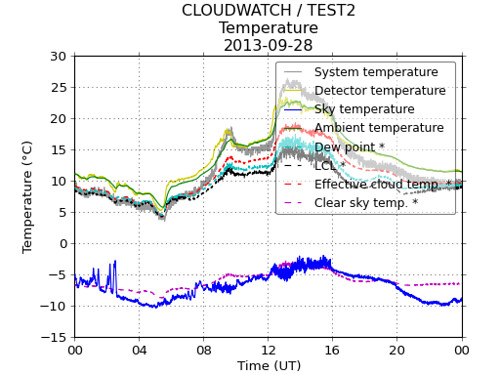
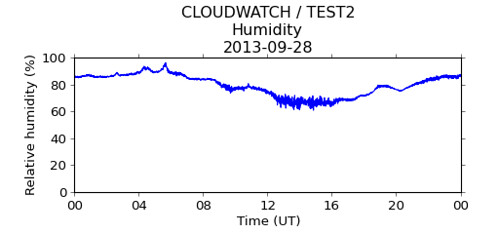
The enclosure design used for the magnetometer isn't suitable for the cloud detector so the prototype cloud detector used a standard IP65 rated box, with the IR temperature sensor pointing upwards to view the sky. The humidity sensor was fitted above a breather hole in the bottom of the box. This concept will continue to be used for the cloud detector; the IR temperature sensor and humidity sensor are fitted to separate PCBs in the top and bottom of the box. To minimise costs the IR temperature and humidity sensors use the same PCB design. The mechanical design of the cloud detector part is something I'd like to improve upon, particularly to reduce the number of PCBs used. However the differing sensor requirements may prevent this.
For a combined system I plan to use the soil pipe to house the fluxgate sensor but locate the rest of the electronics in a separate box following the design of the prototype cloud detector.
Combined magnetometer and cloud detector hardware
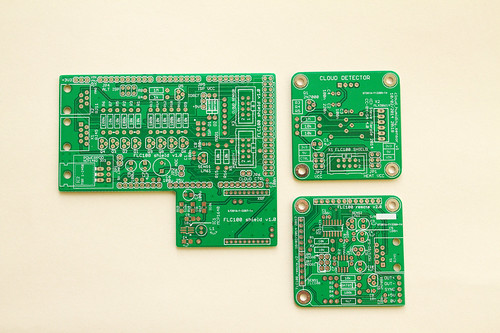 |
| Printed circuit boards for the sensor shield (left), the IR or humidity sensor (top right) and fluxgate magnetometer (bottom right). Click for annotated version. |
The sensor shield is based on the existing design and retains the option of battery-powered operation with radio communication. The magnetometer sensor and analogue-to-digital converter must be powered at 5V, which requires a level-shifting circuit when the microcontroller is powered from 3.3V, which is the case when operating from batteries. For power over ethernet use the microcontroller must also operate at 5V for compatibility with the Arduino Ethernet shield so the level shifting is not required. It is kept however as it provides buffering between the two circuit boards; 1.5m is a considerable distance for an I2C bus. The cloud detector uses a non-contact infra-red temperature sensor operating at 3.3V so a level-shifting circuit is required for PoE operation where the microcontroller is connected to 5V. (I've ignored the fact that a 5V version of the sensor exists since it isn't readily available in the UK). The sensor shield allows a humidity sensor to be connected so that estimates of the clear sky and cloudy sky temperatures can be made. As before, an on-board LM61 temperature sensor monitors the system temperature. The new sensor shield also adds a header to fit an Embedded Adventures lightning sensor module. I don't have one of these at the moment so I can't be certain it will work and there is no software support for it in the existing firmware. Fitting it at the same time as the cloud detector sensors will require long break-away headers to be soldered to the bottom of the lightning sensor module.
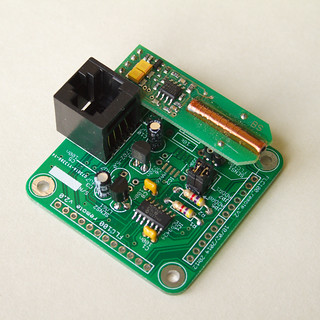 |
| Fluxgate magnetometer sensor mounted on its sensor PCB. Click for annotated version. |
The fluxgate sensor is fitted on its own PCB which contains the analogue to digital converter. For PoE operation a linear voltage regulator is used to convert from 9V to the 5V supply it requires. For battery operation a MAX619 DC-DC charge pump boosts the battery voltage to 5V. Almost all of the temperature variation can be removed by placing the PCB at the bottom of a 1m length of soil pipe. The pipe is buried to a depth of 0.85m with its axis vertical. In the magnetometer-only system the microcontroller, sensor shield and ethernet shield (or batteries for the wireless version) are fitted onto a wooden frame to hold them into the top part of the tube. Positioning the rest of the system away from the fluxgate sensor helps to avoid unwanted effects from any ferro-magnetic components (such as the batteries), it also aids access and enables wireless data transmission.
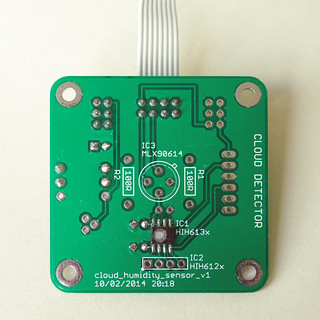 |
| Honeywell HIH6131 humidity sensor mounte on its sensor PCB. The same PCB design is also used for the MLX90614 IR temperature sensor. Click for annotated version. |
The enclosure design used for the magnetometer isn't suitable for the cloud detector so the prototype cloud detector used a standard IP65 rated box, with the IR temperature sensor pointing upwards to view the sky. The humidity sensor was fitted above a breather hole in the bottom of the box. This concept will continue to be used for the cloud detector; the IR temperature sensor and humidity sensor are fitted to separate PCBs in the top and bottom of the box. To minimise costs the IR temperature and humidity sensors use the same PCB design. The mechanical design of the cloud detector part is something I'd like to improve upon, particularly to reduce the number of PCBs used. However the differing sensor requirements may prevent this.
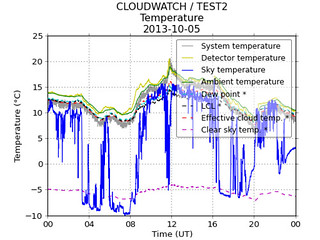
Does it work?
I've not yet deployed a system outside but testing indicates the new printed circuit boards work as intended when used in power over ethernet mode. Battery-powered operation on this new version has not yet been tested.
Design files
The design files (hardware, firmware and software) are open source and can all be downloaded from the Github repository. A PDF version of the user manual describing how to construct and operate the magnetometer can be downloaded from http://aurorawatch.lancs.ac.uk/manual.pdf. At the time of writing only instructions to build the original FLC100 shield are included. Instructions to build the combined sensor shield described above will be added in due course.