As part of element14’s Build Inside the Box Challenge, James Lewis (AKA Bald Engineer) decided to make his own DIY tricoder from Star Trek. In the series, a tricoder is a ubiquitous scanning tool that can perform various scans of the environment through its onboard sensors, as well as record and analyze them later — all in a handheld format. Lewis’ design incorporates a MKR Zero as the microcontroller, a phototransistor to detect light levels, and an analog temperature sensor to sense ambient temperatures.
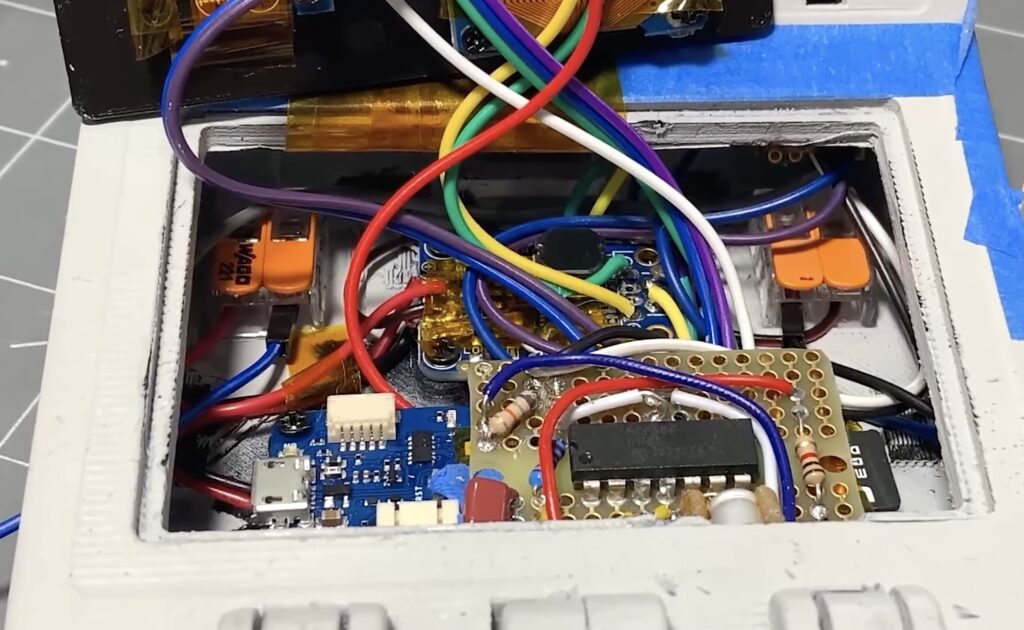
The enclosure itself was based on a tricorder toy and recreated in Fusion 360. It features a hinge mechanism for easy opening and closing, as well as handling the wiring harness that connects both halves of the device. Once it was 3D-printed, Lewis moved onto the electronics.
A VL53L0X time of flight sensor was used to detect if the hinge was open, and thus if the OLED information screens should be turned on. Lewis utilized the SAM D21’s onboard capacitive touch controller to add four buttons onto his device for simple inputs. Finally, the DIY tricorder can play looped WAV files via its onboard SD card and DAC, along with an external op-amp and speaker circuit.
To read more about how the Bald Engineer created this fun project and view its associated schematics, code, and design files, be sure to check out its write-up here on element14’s website. You can also see the build log and demonstration below!
One of the hardest, but sometimes best, things you can do for a project is to walk away. [Jroobi] had spent hundreds of hours crafting the digital dash for his MX5 Miata (video, embedded below) and after spending far too long chasing down I2C bugs, he made the difficult decision to step away for a while. However, as of May 2021, [Jroobi] returned to the project and found a power supply was under-specified and was causing brownouts that resulted in crashes.
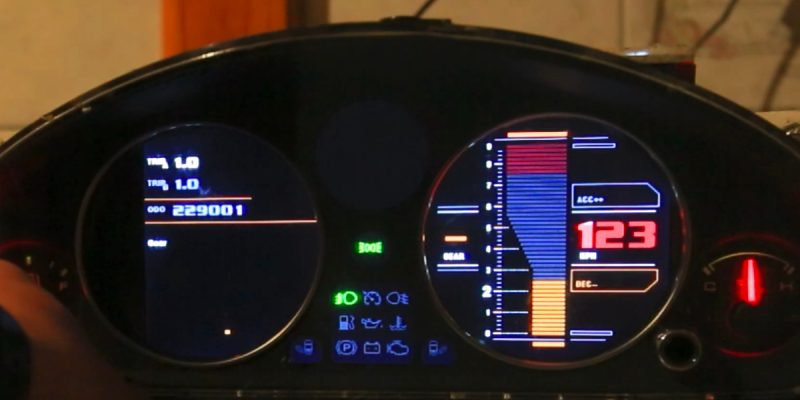
All in all, it’s an incredible work of engineering. Everything from the massive codebase that describes all the different states to the tasteful graphic design is masterfully done. The Star-Trek-inspired theme and attention to detail really show in the different modes on the tachometer. The dynamic soft RPM limit based on engine temperature is particularly ingenious.
Under the hood of this custom dash are two Ardunios running the show. The center media console offers more controls with a generous touch screen while the instrument cluster shows most of the data. They talk over I2C to each other and communicate with other parts in the car, such as the RGB cabin lighting and the TEIN electronic suspension dampeners. Fuel and temperature levels come in as voltage levels which can be read via an ADC. The gear position is calculated based on RPMs and speed given the wheel size and the transmission in the vehicle.
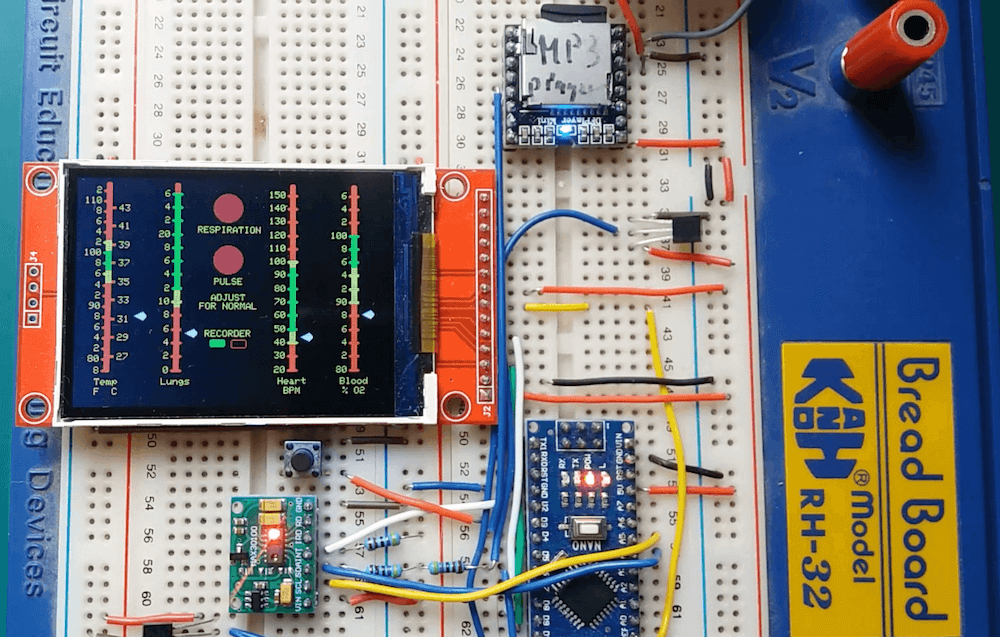
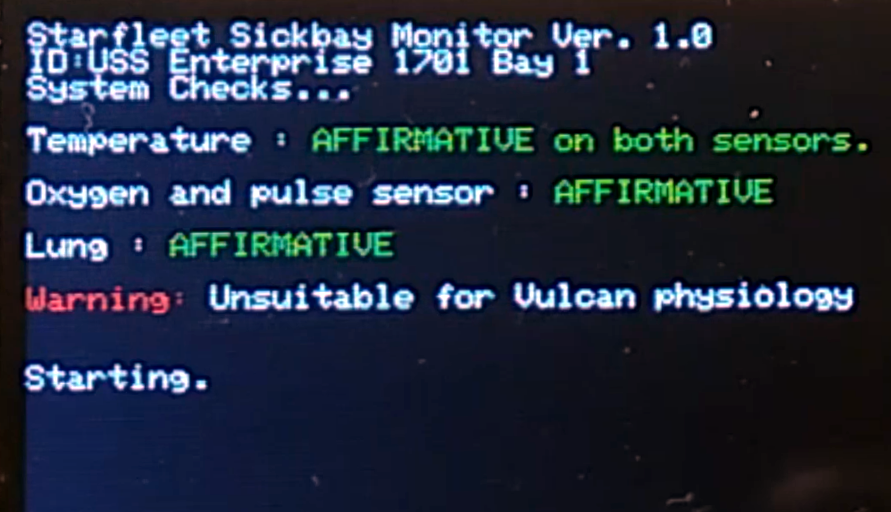
The future envisioned in the original Star Trek included, among other things, a shipboard sickbay with electronic monitors strangely reminiscent of the machines that medical personnel use today. To recreate a functional mini-replica of these displays, YouTuber Xtronical turned to a 2.8” TFT screen, a breadboard, and an Arduino Nano—noting that an Uno would also work.
The LCD display nails the look of Dr. McCoy’s device, and heartbeat sound can be played along with an onscreen flashing “PULSE” circle. A MAX30100 pulse/oximeter sensor and a temperature sensor take body readings, while a second DS18B20 is implemented to read ambient conditions for increased accuracy.
It’s a fun Trekkie project, and Xtronical plans to elaborate on how it was made in future videos.
A build of a working original Star Trek display with real sampled heart beat sound. Uses various sensors to get the readings from your body (via just your fingers) and displays them in the style of the 60’s sick bay screen. This bare “Bones” system could be built into a model unit or even a replica Tricorder.
The various displays and interfaces in Star Trek, especially The Original Series, were intentionally designed to be obtuse and overly complex so they would appear futuristic to the audience. If you can figure out how Sulu was able to fly the Enterprise with an array of unlabeled buttons and rocker switches, we’d love to hear it. But one area of the ship where this abstract design aesthetic was backed off a bit was sickbay, as presumably they wanted the audience to be able to understand at a glance whether or not Kirk or Spock were going to pull through their latest brush with death (spoilers: they’re fine).
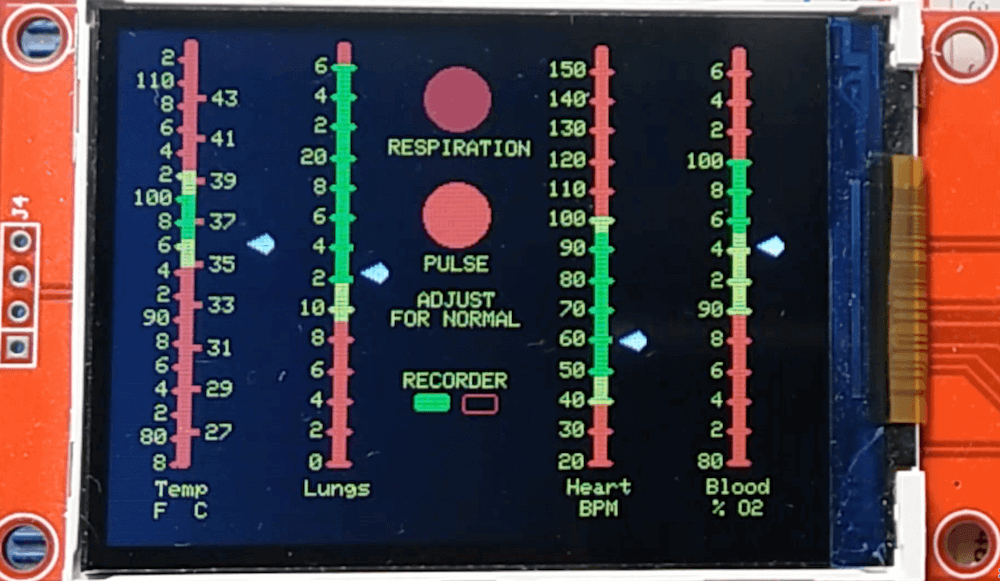
For his latest project, [XTronical] has recreated the classic displays from Dr McCoy’s sickbay with an Arduino Nano and a 2.8 inch LCD display. It even has a speaker and MP3 player module to recreate the “heartbeat” sound from the original show. The whole thing looks and sounds phenomenal, and would be a perfect desk toy for the classic Trek aficionado. But this isn’t just a toy, it’s a fully functional medical scanner.
Of course, this little gadget can’t tell you if you’ve come down with a nasty case of Rigellian fever, but it can read your vitals using a MAX30100 pulse oximeter module and DS18B20 thermometer. In fact, it actually has two DS18B20 sensors: one to measure ambient temperature, the other to measure skin temperature. With those two figures, [XTronical] says it can calculate your core body temperature. The only thing that’s made up is the blinking “Respiration” indicator, that one’s just an estimate.
The various displays and interfaces in Star Trek, especially The Original Series, were intentionally designed to be obtuse and overly complex so they would appear futuristic to the audience. If you can figure out how Sulu was able to fly the Enterprise with an array of unlabeled buttons and rocker switches, we’d love to hear it. But one area of the ship where this abstract design aesthetic was backed off a bit was sickbay, as presumably they wanted the audience to be able to understand at a glance whether or not Kirk or Spock were going to pull through their latest brush with death (spoilers: they’re fine).
For his latest project, [XTronical] has recreated the classic displays from Dr McCoy’s sickbay with an Arduino Nano and a 2.8 inch LCD display. It even has a speaker and MP3 player module to recreate the “heartbeat” sound from the original show. The whole thing looks and sounds phenomenal, and would be a perfect desk toy for the classic Trek aficionado. But this isn’t just a toy, it’s a fully functional medical scanner.
Of course, this little gadget can’t tell you if you’ve come down with a nasty case of Rigellian fever, but it can read your vitals using a MAX30100 pulse oximeter module and DS18B20 thermometer. In fact, it actually has two DS18B20 sensors: one to measure ambient temperature, the other to measure skin temperature. With those two figures, [XTronical] says it can calculate your core body temperature. The only thing that’s made up is the blinking “Respiration” indicator, that one’s just an estimate.
Building a real-life version of the Star Trek tricorder has been the goal of engineers and hackers alike since the first time Dr McCoy complained about being asked to work outside of his job description. But while modern technology has delivered gadgets remarkably similar in function, we’ve still got a long way to go before we replicate 24th century Starfleet design aesthetic. Luckily there’s a whole world of dedicated hackers out there who are willing to take on the challenge.
[Taste The Code] is one such hacker. He wanted to build himself a practical gadget that looked like it would be at home on Picard’s Enterprise, so he gathered up the components to build a hand-held heart rate monitor and went in search for a suitable enclosure. The electronics were simple enough to put together thanks to the high availability and modularity we enjoy in a post-Arduino world, but as you might expect it’s somewhat more difficult to put it into a package that looks suitably sci-fi while remaining functional.
Internally his heart rate monitor is using an Arduino Pro Mini, a small OLED screen, and a turn-key pulse sensor which was originally conceived as a Kickstarter in 2011 by “World Famous Electronics”. Wiring is very simple: the display is connected to the Arduino via I2C, and the pulse sensor hooks up to a free analog pin. Everything is powered by 3 AA batteries delivering 4.5 V, so he didn’t even need a voltage regulator or the extra components required for a rechargeable battery pack.
Once everything was confirmed working on a breadboard, [Taste The Code] started the process of converting a handheld gyroscopic toy into the new home of his heart rate monitor. He kept the battery compartment in the bottom, but everything else was stripped out to make room. One hole was made on the pistol grip case so that a finger tip could rest on the pulse sensor, and another made on the side for the OLED screen. This lets the user hold the device in a natural way while getting a reading. He mentions the sensor can be a bid fiddly, but overall it gives accurate enough readings for his purposes.
There have been a lot of smart computers on TV and movies. We often think among the smartest, though, are the ones on Star Trek. Not the big “library computer” and not the little silver portable computers. No, the smart computers on Star Trek ran the doors. If you ever watch, the doors seem to know the difference between someone walking towards it, versus someone flying towards it in the middle of a fist fight. It also seems to know when more people are en route to the door.
Granted, the reason they are so smart is that the doors really have a human operating them. For the real fan, though, you can buy a little gadget that looks like an intercom panel from the Enterprise. That would be cool enough, but this one has sound effects and can sense when someone walks into your doorway so they can hear the comforting woosh of a turbolift door.
Of course, for the real hacker, that’s not good enough either. [Evan] started with this $25 gadget, but wanted to control it with an Arduino for inclusion in his hackerspace’s pneumatic door system. He did a bit of reverse engineering, a bit of coding, and he wound up in complete control of the device.
The internals of the device were mostly straightforward with some PIR sensors, switches, LEDs, and some epoxy blobs that produce the sound and control the logic. [Evan] had to be a little creative since the red alert sound, once started, would not stop for some time. The solution? Let the Arduino cut power to the board when it wants silence.
The code is available on GitHub. There were a few other tricks required, including removing a PIR sensor chip and adding a USB to serial adapter. Once you can treat the whole thing as an I/O device, you could probably do a lot of interesting projects easily. And of course, this sort of offering would be perfect as an entry in the Hackaday Sci-Fi contest.
For some reason, we don’t see as many original series hacks as we do for the Next Generation. We have, though, seen at least one other swoosh door. On the other hand, if you fly against that door while being thrown by a Captain Kirk style body slam the door will still open. We can’t vouch for it, but this video has an interesting analysis of the door noise that reminded us of a modern version of playing our old LPs backward.
It was Stardate 2267. A mysterious life form known as Redjac possessed the computer system of the USS Enterprise. Being well versed in both computer operations and mathematics, [Spock] instructed the computer to compute pi to the last digit. “…the value of pi is a transcendental figure without resolution” he would say. The task of computing pi presents to the computer an infinite process. The computer would have to work on the task forever, eventually forcing the Redjac out.
Calculus relies on infinite processes. And the Arduino is a (single thread) computer. So the idea of running a calculus function on an Arduino presents a seemingly impossible scenario. In this article, we’re going to explore the idea of using derivative like techniques with a microcontroller. Let us be reminded that the derivative provides an instantaneous rate of change. Getting an instantaneous rate of change when the function is known is easy. However, when you’re working with a microcontroller and varying analog data without a known function, it’s not so easy. Our goal will be to get an average rate of change of the data. And since a microcontroller is many orders of magnitude faster than the rate of change of the incoming data, we can calculate the average rate of change over very small time intervals. Our work will be based on the fact that the average rate of change and instantaneous rate of change are the same over short time intervals.
Houston, We Have a Problem
In the second article of this series, there was a section at the end called “Extra Credit” that presented a problem and challenged the reader to solve it. Today, we are going to solve that problem. It goes something like this:
We have a machine that adds a liquid into a closed container. The machine calculates the amount of liquid being added by measuring the pressure change inside the container. Boyle’s Law, a very old basic gas law, says that the pressure in a closed container is inversely proportional to the container’s volume. If we make the container smaller, the pressure inside it will go up. Because liquid cannot be compressed, introducing liquid into the container effectively makes the container smaller, resulting in an increase in pressure. We then correlate the increase in pressure to the volume of liquid added to get a calibration curve.
The problem is sometimes the liquid runs out, and gas gets injected into the container instead. When this happens, the machine becomes non-functional. We need a way to tell when gas gets into the container so we can stop the machine and alert the user that there is no more liquid.
One way of doing this is to use the fact that the pressure in the container will increase at a much greater rate when gas is being added as opposed to liquid. If we can measure the rate of change of the pressure in the container during an add, we can differentiate between a gas and a liquid.
Quick Review of the Derivative
Before we get started, let’s do a quick review on how the derivative works. We go into great detail about the derivative here, but we’ll summarize the idea in the following paragraphs.
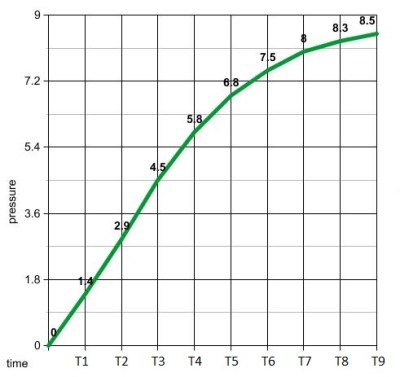
Full liquid add
An average rate of change is a change in position over a change in time. Speed is an example of a rate of change. For example, a car traveling at 50 miles per hour is changing its position at 50 mile intervals every hour. The derivative gives us an instantaneous rate of change. It does this by getting the average rate of change while making the time intervals between measurements increasingly smaller.
Let us imagine a car is at mile marker one at time zero. An hour later, it is at mile marker 50. We deduce that the average speed of the car was 50 miles per hour. What is the speed at mile marker one? How do we calculate that? [Issac Newton] would advise us to start getting the average speeds in smaller time intervals. We just calculated the average speed between mile marker 1 and 50. Let’s calculate the average speed between mile marker’s 1 and 2. And then mile marker’s 1 and 1.1. And then 1 and 1.01, then, 1.001…etc. As we make the interval between measurements smaller and smaller, we begin to converge on the instantaneous speed at mile marker one. This is the basic principle behind the derivative.
Average Rate of Change
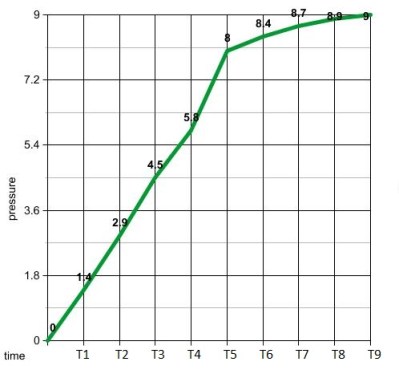
Gas enters between time T4 and T5
We can use a similar process with our pressure measurements to distinguish between a gas and a liquid. The rate of change units for this process is PSI per second. We need to calculate this rate as the liquid is being added. If it gets too high, we know gas has entered the container. First, we need some data to work with. Let us make two controls. One will give us the pressure data for a normal liquid add, as seen in the graph above and to the left. The other is the pressure data when the liquid runs out, shown in the graph on the right. Visually, it’s easy to see when gas gets in the system. We see a surge between time’s T4 and T5. If we calculate the average rate of change between 1 second time intervals, we see that all but one of them are less that 2 psi/sec. Between time’s 4 and 5 on the gas graph, the average rate of change is 2.2 psi/sec. The next highest change is 1.6 psi/sec between times T2 and T3.
So now we know what we need to do. Monitor the rates of change and error out when it gets above 2 psi/sec.
Our psuedo code would look something like:
pressure = x;
delay(1000);
pressure = y
rateOfChange = (y - x);
if (rateOfChange > 2)
digitalWrite(13, HIGH);  //stop machine and sound alarm
Instantaneous Rate of Change
It appears that looking at the average rate of change over a 1 second time interval is all we need to solve our problem. If we wanted to get an instantaneous rate of change at a specific time, we need to make that 1 second time interval smaller. Let us remember that our microcontroller is much faster than the changing pressure data. This gives us the ability to calculate an average rate of change over very small time intervals. If we make them small enough, the average rate of change and instantaneous rate of change are essentially the same.
Therefore, all we need to do to get our derivative is make the delay smaller, say 50ms. You can’t make it too small, or your rate of change will be zero. The delay value would need to be tailored to the specific machine by some old fashioned trial and error.
Taking the Limit in a Microcontroller?
One thing we have not touched on is the idea of the limit within a microcontroller. Mainly, because we don’t need it. Going back to our car example, if we can calculate the average speed of the car between mile marker one and mile marker 0.0001, why do we need to go though a limiting process? We already have our instantaneous rate of change with the single calculation.
One can argue that the idea behind the derivative is to converge on a single number while going though a limiting process. Is it possible to do this with incoming data of no known function? Let’s try, shall we? We can take advantage of the large gap between the incoming data’s rate of change and the processor’s speed to formulate a plan.
Let’s revisit our original problem and set up an array. We’ll fill the array with pressure data every 10ms. We wait 2 seconds and obtain 200 data points. Our goal is to get the instantaneous rate of change of the middle data point by taking a limit and converging on a single number.
We start by calculating the average rate of change between data points 200 and 150. We save the value to a variable. We then get the rate of change between points 150 and 125. We then compare our result to our previous rate by taking the difference. We continue this process of getting the rate of change between increasingly smaller amounts of time and comparing them by taking the difference. When the difference is a very small number, we know we have converged on a single value.
We then repeat the process in the opposite direction. We calculate the average rate of change between data points 0 and 50. Then 50 and 75. We continue the process just as before until we converge on a single number.
If our idea works, we’ll come up with two values that would look something like 1.3999 and 1.4001 We say our instantaneous rate of change at T1 is 1.4 psi per second. Then we just keep repeating this process.
Now it’s your turn. Think you have the chops to code this limiting process?
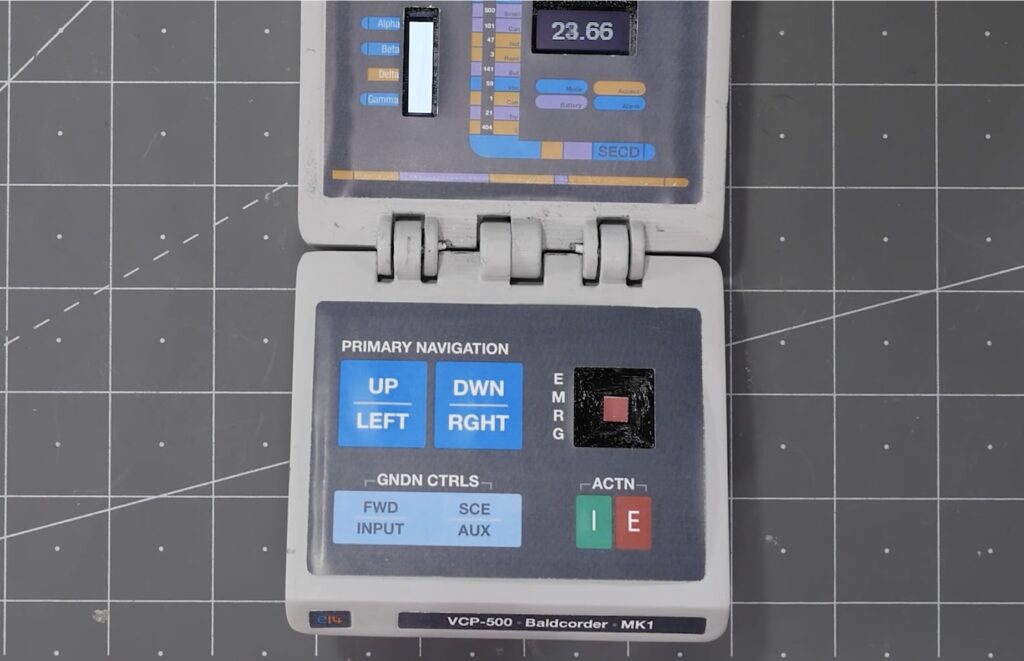
Scott, Blair, and Bob of the USS Nokomis Star Trek fan club, who also frequent Minneapolis’ Hack Factory, built this control panel for a local science fiction convention. It’s powered by an Arduino, which controls the lights and buttons, and a RasPi, which manages the sound. The Arduino also scans […]
Planet Arduino is, or at the moment is wishing to become, an aggregation of public weblogs from around the world written by people who develop, play, think on Arduino platform and his son. The opinions expressed in those weblogs and hence this aggregation are those of the original authors. Entries on this page are owned by their authors. We do not edit, endorse or vouch for the contents of individual posts. For more information about Arduino please visit www.arduino.cc
You are currently browsing the archives for the star trek category.


 running a calculus function on an Arduino presents a seemingly impossible scenario. In this article, we’re going to explore the idea of using derivative like techniques with a microcontroller. Let us be reminded that the derivative provides an instantaneous rate of change. Getting an instantaneous rate of change when the function is known is easy. However, when you’re working with a microcontroller and varying analog data without a known function, it’s not so easy. Our goal will be to get an average rate of change of the data. And since a microcontroller is many orders of magnitude faster than the rate of change of the incoming data, we can calculate the average rate of change over very small time intervals. Our work will be based on the fact that the average rate of change and instantaneous rate of change are the same over short time intervals.