Posts | Comments

Planet Arduino

Archive for the ‘debugger’ Category

RP2040-GEEK

Waveshare RP2040-GEEK is a development board that looks like a USB flash drive but is based on a Raspberry Pi RP2040 microcontroller with a 1.14-inch 65K color LCD and some expansion ports all housed in a white plastic case. The device comes with a 4MB flash to store the firmware, a microSD card slot for data storage, a BOOT button to enter bootloader mode, two 3-pin connectors for UART and SWD debug, and a 4-pin I2C port. Waveshare RP2040-GEEK specifications: MCU – Raspberry Pi RP2040 dual-core Arm Cortex-M0+ microcontroller clocked up to 133 MHz with 264 kB SRAM Storage – 4MB flash (W25Q32JVSSIQ) and microSD card slot Display – 1.14-inch 240×135 pixel 65K color IPS LCD display USB – 1x USB Type-A female port for power and programming Debugging – 3-pin SWD port for connecting a target board; the standard CMSIS-DAP interface can be used to debug most Arm-based microcontrollers; [...]

The post Waveshare RP2040-GEEK USB development board features RP2040 MCU, 1.14-inch color display, UART/I2C/SWD ports appeared first on CNX Software - Embedded Systems News.

For as popular as the Arduino platform is, it’s not without its problems. Among those is the fact that most practical debugging is often done by placing various print statements throughout the code and watching for them in the serial monitor. There’s not really a great way of placing breakpoints or stepping through code, either. But this project, known as eye2see, hopes to change that by using the i2c bus found in most Arduinos to provide a more robust set of debugging tools.

The eye2see software is set up to run on an Arduino or other compatible microcontroller, called the “probe”, which is connected to the i2c bus on another Arduino whose code needs to be debugged. Code running on this Arduino, which is part of the eye2see library, allows it to send debugging information to the eye2see probe. With a screen, the probe can act as a much more powerful debugger than would otherwise typically be available, being able to keep track of variables in the main program, setting up breakpoints, and outputting various messages on its screen.

The tool is not without its downsides, though. The library that needs to run on the host Arduino slows down the original program significantly. But for more complex programs, the tradeoff with powerful debugging tools may be worth it until these pieces of code can be removed and the program allowed to run unencumbered. If you’d like to skip needing to use a second Arduino, we’ve seen some other tools available for debugging Arduino code that can run straight from a connected PC instead.

Screenshot of debugging the Wokwi Arduino simulator

Being able to track down a bug in a mountain of source code is a skill in its own right, and it’s a hard skill to learn from a book or online tutorial. Besides the trial-by-fire of learning while debugging your own project, the next best thing is to observe someone else’s process. [Uri Shaked] has given us a great opportunity to brush up on our debugging skills, as he demonstrates how to track down and squish a bug in the Wokwi Arduino simulator.

A user was kind enough to report the bug and include the offending Arduino sketch. [Uri]’s first step was to reduce the sketch to the smallest possible program that would still produce the bug.

Once a minimal program had been produced, it was time to check whether the problem was in one of the Arduino libraries or in the Wokwi simulator. [Uri] compiled the sketch, loaded it onto a ATtiny85, and compared the behavior of the simulator and the real thing. It turns out the code ran just fine on a physical ATtiny, so the problem must have been in the Arduino simulator itself.

To track down the bug in the simulator, [Uri] decided to break out the big gun—GDB. What follows is an excellent demonstration of how to use GDB to isolate a problem by examining the source code and using breakpoints and print statements. In the end, [Uri] managed to isolate the problem to a mis-placed bit in the simulation of the timer/counter interrupt flag register.

If you’d like to see more of [Uri]’s debugging prowess, check out his dive into an ATtiny’s write protection and configuration fuses. If you’ve been wowed by the power of GDB and want to learn more, check out this quick tutorial!

Arduino has partnered with Segger to further support developers in creating their own embedded systems, implementing compatibility of Segger debugging solutions with Portenta boards. 

Debuggers are the scalpel that allows a developer to dissect any application code running on embedded hardware. This versatile tool helps the programmer to halt programs at specific points, inspect values stored in memory units, modify CPU registers and enter test data to narrow down on buggy pieces of code. This tool comes in handy when you want to locate malfunctioning code and fix faulty program execution.

J-Link debug probes are the most popular choice for optimizing the debugging and flash programming experience. Among the key benefits are:

  • Record-breaking flashloaders, up to 3MB/s RAM download speed.
  • Unlimited Flash Breakpoints feature allows the user to set an unlimited number of breakpoints when debugging in flash memory.
  • Wide range of CPUs and architectures supported; in fact, everything from single 8051 to mass market Cortex-M to high-end cores like Cortex-A (32- & 64-bit).
  • Direct interface with SPI flashes, without the need of a CPU between J-Link and the SPI flash.
  • Supported by major IDEs.

In the meantime, we’re working to make the Arduino IDE 2.0 compatible with Segger debugger solutions.

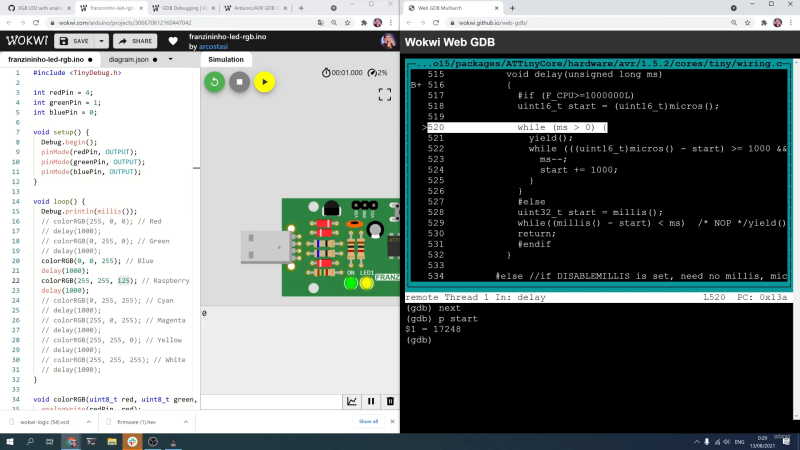
To quickly get started, check out our new tutorials on the Portenta Breakout and MKR boards. You’ll learn how to debug your Arduino sketch by connecting Portenta Breakout to the Segger J-link device and using the Ozone debugger and performance analyzer.

Ozone is Segger’s full-featured graphical debugger for embedded systems. Thanks to features such as trace, code profiling and code coverage analysis, it’s also an extremely powerful performance analyzer. Ozone supports the debugging of any embedded application on C/C++ source and assembly level. It can load applications built with any toolchain/IDE and even debug the target’s resident application without any source. Ozone includes all well-known debug controls and information windows, while making use of the best performance of J-Link debug probes. The user interface is highly intuitive, yet fully configurable. Each window can be moved, re-sized and docked to fit every developer’s needs.

There are four different J-Link models already available on the Arduino Store:

  • J-LINK BASE COMPACT: USB powered JTAG debug probe supports a large number of CPU cores. Based on a 32-bit RISC CPU, it can communicate at high speed with supported target CPUs.
  • J-LINK PLUS COMPACT: With this compact version of the J-Link PLUS, users have an unlimited number of flash breakpoints. Mounts securely and unobtrusively into development and end user equipment
  • J-LINK EDU: Reserved for educational purposes, the J-LINK EDU offers the same functionalities as the J-Link BASE. It’s been designed to allow students, educational facilities and hobbyists access to top of the line debug probe technology.
  • J-LINK EDU MINI: The smallest J-Link debugger, intended for non-commercial use.

To connect the Portenta boards with J-Link debuggers, there are two adapters available: Segger’s 50-Mil 10-Pin Patch Adapter and J-Link 19-pin Cortex-M Adapter. The 50-Mil 10-Pin Patch Adapter converts the standard 20 pin 0.1″ connector to the standard 10-pin 0.05″ Cortex-M connector. This allows custom connections/wiring between the 20-pin and 10-pin side.

The 19-Pin Cortex-M Adapter allows JTAG, SWD, and SWO connections between J-Link and Cortex-M based target hardware systems. It adapts from the 20-pin 0.1” JTAG connector to a 19-pin 0.05” Samtec FTSH connector as defined by Arm.

For more information and tech specs, please check out the Segger items in the store.

The post Enhance your Arduino development with fast and easy debugging from Segger appeared first on Arduino Blog.

There have been plenty of Z80 computer builds here on Hackaday, but what sets them apart is what you do with them. [Andrew] writes in with his Z80 single-board computer made from scratch, using the Arduino standard headers for its I/O. In turn, since he needed an easy way to program the flash memory which holds the software to run on the Z80, he used an Arduino Mega as a debugger, making the SBC an Arduino shield itself.

Using such a common header pinout for the Z80 computer allows it to be used with a variety of readily-available Arduino shields. This compatibility is achieved with an analog-digital converter and a 3.3 V regulator, mimicking the pins found in an Arduino Uno. The code, available on GitHub, includes an extensive explanation and walkthrough over the process in which the Mega takes over the bus from the Z80 to function as a fully-featured debugger. Programs can be loaded through embedding an assembly listing into the Mega’s sketch, or, once the debugger is up you can also upload a compiled hex file through the serial connection.

This isn’t the first time [Andrew] has been featured here, and his past projects are just as interesting. If you need to translate a Soviet-era calculator’s buttons into English, hack a metallurgical microscope or even investigate what’s that Clacking Clanking Scraping Sound, he’s the one you should call.

We’ve all been there. When debugging a microcontroller project, we just want to put in a print statement to figure out what’s going on with the microcontroller in real time. However, advanced embedded programmers know that printf statements are verboten: they’re just too SLOW. While not fixing this plight entirely, [Atakan Sarioglu] has come up with a clever way to create readable debug messages with minimal runtime overhead.

[Atakan Sarioglu]’s innovation, called BigBug (Github), is a dynamically-generated codebook. The codebook translates abbreviated messages sent over serial (UART here) to longer-form human-readable messages. To generate the codebook, BigBug automatically parses your comments to create a lookup between an abbreviation and the long-form message. When you are running your program on the microcontroller, BigBug will translate the short codes to long messages in real-time as you send log/debug data over serial.

For example (not restricted to Arduino-only), if you write Serial.println("HW") //@BB[HW] Hello World!, BigBug will translate the received characters HW\n to Hello World!. In this simple example, the abbreviation uses 3 characters while the fully readable message uses 13 characters, for a savings of ~75% with no loss of clarity. More advanced usage lets you log data: Serial.println("DT 1 1") //@BB[DT] Today's Date is: {0}/{1} becomes Today's Date is 1/1. You can also use enumerated variables (last example could showToday's Date is Jan. 1 with the same print command).

In terms of real-world benefit, using a 115200 baud connection (with 8N1 encoding) this is 115200 bits per second /(8+1) bits per byte = 12800 bytes/sec = 1 byte every 80 microseconds. Sending 13 bytes of Hello World!\n (in a naive, blocking UART implementation) takes ~1 ms of CPU time. With the shortcode HW\n, it would take ~0.25 ms to send essentially the same message (then decoded by BigBug). Note that because this just operates on serial data, BigBug is language independent

If you’ve been constrained by serial throughput for debugging, this looks like a well-polished tool to solve your problems. If you are just using an Arduino and throughput is no issue, then try this tool to debug Arduino programs. Or you could always double-down and use a microcontroller to debug another microcontroller.

As every Hackaday reader knows, and tells us at every opportunity in the comments, adding an Arduino to your project instantly makes it twice as cool. But what if, in the course of adding an Arduino to your project, you run into a problem and need to debug the code? What if you could use a second Arduino to debug the first? That would bring your project up to two Arduinos, instantly making it four times as awesome as before you started! Who could say no to such exponential gains?

Debugging an ATTiny85

Not [Wayne Holder], that’s for sure. He writes in to let us know about a project he’s been working on for a while that allows you to debug the execution of code on an Arduino with a second Arduino. In fact, the target chip could even be another AVR series microcontroller such as a the ATTiny85. With his software you can single-step through the code, view and modify values in memory, set breakpoints, and even disassemble the code. Not everything is working fully yet, but what he has so far is very impressive.

The trick is exploiting a feature known as “debugWIRE” that’s included in many AVR microcontrollers. Unfortunately documentation on this feature is hard to come by, but with some work [Wayne] has managed to figure out how most of it works and create an Arduino Sketch that lets the user interact with the target chip using a simple menu system over the serial monitor, similar to the Bus Pirate.

[Wayne] goes into plenty of detail on his site and in the video included after the break, showing many of the functions he’s got working so far in his software against an ATTiny85. If you spend a lot of time working on AVR projects, this looks like something you might want to keep installed on an Arduino in your tool bag for the future.

Debugging microcontroller projects can be a huge time saver when your code starts running on real hardware, but often takes some hacking to get working.

If you’ve done 3D printing, you’ve probably at least heard of Tinkercad. This popular CAD package runs in your browser and was rescued from oblivion by Autodesk a few years ago. [Chuck] recently did a video about a new Tinkercad feature: building and simulating virtual Arduino circuits. You can watch it below.

There are a variety of components you can add to your design. You’ll find an integrated code editor and a debugger. You can even get to the serial monitor, all in your browser with no actual Arduino hardware. You can also build simple circuits that don’t use an Arduino, although the component selection is somewhat limited.

This could be great for teaching Arduino in classrooms or when you want to do some development in a hotel room. The layout is very visual, so if you are accustomed to reading schematics, you may not appreciate the style. In addition, the selection of components is somewhat limited (including only supporting the Arduino UNO, as far as we could tell). So for educational purposes, it is great. For breadboarding your next great Arduino-powered robot, maybe not so much.

If you remember Circuits123 (or circuits.io), this is the same underlying technology. They’ve just integrated it with Tinkercad. However, there doesn’t seem to be any real integration between the two other than they are on the same web page now. Perhaps in the future, they’ll let you drop components on the circuit that also show up in the 3D design (or, at least, with sockets or holders for those components).

However, having a simulated Arduino with a debugger could come in handy even if you don’t care about the circuit simulations. If you really want to do circuit simulation, it is hard to go wrong with LTSpice. If you really want it to be in your browser, there’s always Falstad.


Filed under: Arduino Hacks
May
15

Meet Arduino ZERO – the new board jointly developed by Arduino and Atmel

Announcements, arduino, atmel, debugger, iot, Zero Comments Off on Meet Arduino ZERO – the new board jointly developed by Arduino and Atmel 

ArduinoZero

It’s a pleasure to announce the latest development board, Arduino Zero, expanding the Arduino family by providing increased creative opportunities to the maker community.

Arduino and Atmel unveil the Arduino Zero, a simple and powerful 32-bit extension of the platform established by Arduino UNO. It aims to provide creative individuals with the potential to realize truly innovative ideas especially for smart IoT devices, wearable technology, high-tech automation, crazy robotics, and projects not yet imagined.

The board is powered by Atmel’s SAMD21 MCU, which features a 32-bit ARM Cortex® M0+ core and one of its most important feature is Atmel’s Embedded Debugger (EDBG), which provides a full debug interface without the need for additional hardware, significantly increasing the ease-of-use for software debugging. EDBG also supports a virtual COM port that can be used for device programming and traditional Arduino boot loader functionality.

Massimo Banzi, Arduino co-founder and CEO said:

“The flexible feature set enables endless project opportunities for devices and acts as a great educational tool for learning about 32-bit application development.”

Reza Kazerounian, senior vice president and general manager, microcontroller business unit at Atmel added:

“Leveraging more than 15 years of experience since the inception of AVR, simplicity and ease-of-use have been at the core of Atmel’s technology, Atmel is pleased to see the continued growth of the global maker community stemming from the increasing access and availability to open source platforms such as Arduino. We enable makers, but the power lies within the makers themselves.”

The first prototypes of Arduino Zero will be on display at Maker Faire Bay Area 2014 in San Mateo on May 17 and 18 at the following booths:
Arduino Booth: #204
Atmel Booth: #205
ARM Booth: #405

See you there!

Arduino Zero-top


serial01

A serial monitor is an easy way to debug your projects. As we step through code, it’s nice to see a “Hey! I’m working, moving to next thing!” across the monitor, and not so nice to see nothing – the result of a bug that needs debugging. This has always meant needing a PC loaded with your favorite serial terminal program close at hand.

Most of the time this is not an issue, because the PC is used to compile the code and program the project at hand. But what if you’re in the field, with a mission of fixing a headless system, and in need a serial monitor? Why lug around your PC when you can make your own External Serial Monitor!

[ARPix] built this fully functional serial monitor based on an Atmega328 and a 102 x 64 LCD display. While it doesn’t have a keyboard port like this microcontroller based serial terminal, tact switches allow access to the user interface to start and stop the reading and set the baud rate. The Atmega328 has 2K of SRAM, which is needed for the project. Apparently, 1K was not enough to handle all the data. All code, schematics and a very well done parts layout are available, making this sure to be your next weekend project!


Filed under: Arduino Hacks, Microcontrollers


  • Newsletter

    Sign up for the PlanetArduino Newsletter, which delivers the most popular articles via e-mail to your inbox every week. Just fill in the information below and submit.

  • Like Us on Facebook