Surely you’ve been there: you need to capture serial output from a microcontroller or other device, so you reach for a PL2303 or CP210x or FT232RL-based USB-to-TTL serial cable (if you can remember where you put the damn thing after you last used it!) and…realize you don’t have the drivers installed on the computer you […]
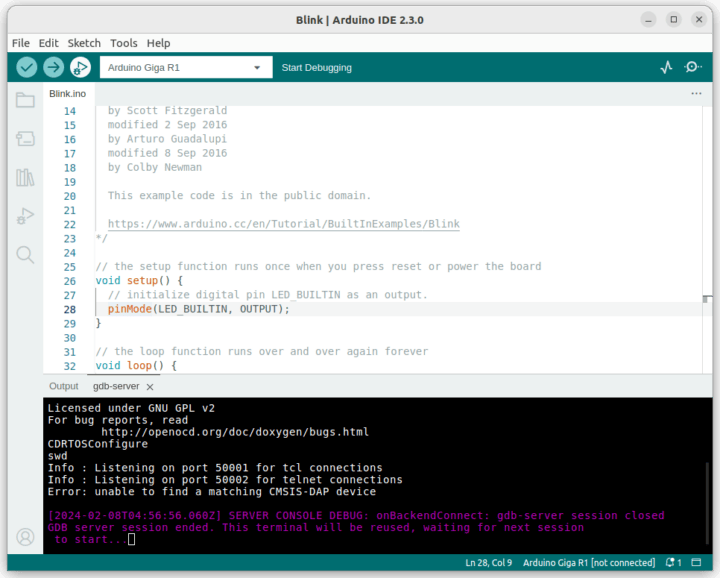
Arduino IDE 2.3 has just been released with a range of bug fixes and improvements, but the main change is that the debug feature is not experimental anymore and is now considered stable. Bug fixes include addressing CVE-2023-4863 security flaw (See GitHub for related commits) and based on the wording used in the announcement it looks to be the only one… So the main news is that the Debug feature is now fully incorporated into the IDE. But what is it exactly? The new documentation website explains that Arduino CLI 0.9.0 and Arduino IDE 2.x support “sketch debugging” with openocd server. Arduino also explains it’s currently supported by Arduino boards based on the Mbed core including GIGA R1 WiFi, Portenta H7, Opta, Nano BLE, and Nano RP2040 Connect, and Renesas-based boards such as UNO R4 and Portenta C33 will get support very soon. The company also says they are working [...]
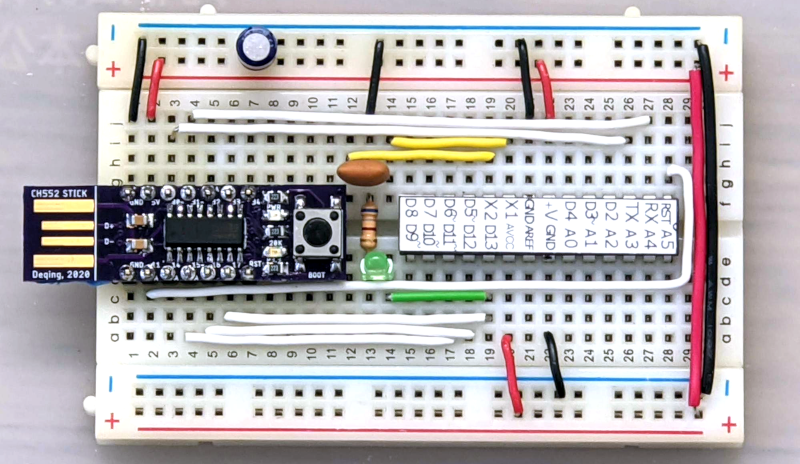
One of the things missing from the “classic” Arduino experience is debugging. That’s a shame, too, because the chips used have that capability. However, the latest IDE has the ability to work with external debuggers and if you want to get started with a classic ATMega Arduino, [deqing] shows you how to get started with a cheap CH552 8-bit USB microcontroller board as the debugging dongle.
The CH552 board in question is a good choice, primarily because it is dirt cheap. There are design files on GitHub (and the firmware), but you could probably pull the same trick with any of the available CH552 breakout boards.
There was a time when having a god-eye view of your embedded system required an expensive in-circuit emulation system. These were expensive, difficult to deploy, and rare. Then, CPUs started adding debugging hardware right on the chip. A few spare pins on the CPU and some sort of adapter would give you most of what you wanted from an emulation system. Although these adapters are often proprietary, sometimes they aren’t, or they have been reverse-engineered. If you know the protocol, it is easy enough to get a processor to speak it for you. That’s why you often see, for example, Raspberry Pi Picos debugging other Picos. There’s nothing you can’t do a million other ways here, but it is an excellent step-by-step tutorial for getting started without breaking the bank.
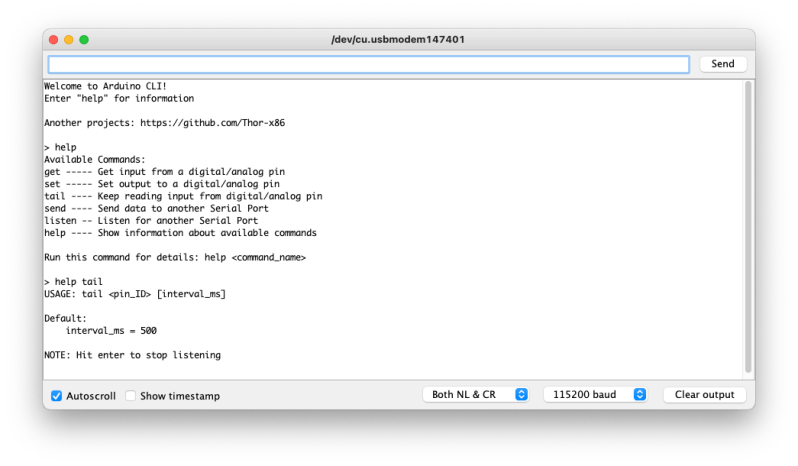
Need to quickly toggle or read some logic signals without the hassle of writing a quick program? [Thor_x86], aka [Eric], built an Arduino sketch that does just that — and he threw in the ability to send (or receive) serial messages, too. This is a neat idea — kind of a simplified Bus Pirate.
We should warn you that this is an early release, and there are a few minor issues which we are sure [Eric] will iron out soon. We discovered the function strtol() was misspelled in cmd_send.cpp, and there are some configuration #defines which need to be sorted out in file parsePin.cpp, depending on which Arduino module you are running. We got it running on an Arduino Leonardo the quickest, because it has support for Serial1().
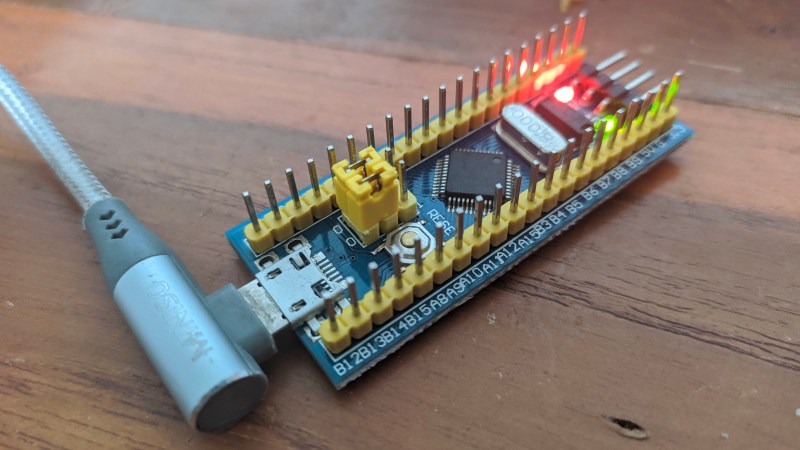
Don’t be discouraged by these glitches in this rev 0 deployment — [Eric] has really made quite a nice tool here. Check his GitHub repository for updates (or submit corrections yourself). All in all, it’s a good addition to your digital tool box. On a completely unrelated note, we really like [Eric]’s USB cable with the right-angle micro connector, grungy though it may be.
Besides the standard tools like Bus Pirate, GreatFET, FTDI modules, etc., are there any similar tools you like to use for bit banging and serial testing? Let us know in the comments below.
Sometimes debugging just doesn’t go the way you want it to. When USB problems arise, you can usually use a protocol analyzer to find the issue causing trouble. For [Paul Stoffregen], it was only the first step in a long process to find the culprit.
Procotol Analyzer
The complaint that came up was from a customer whose 2 port USB hub wasn’t working on their Teensy 3.6. The hub had been tested on Linux, Mac, and Windows, so it made sense to test what was different about the Teensy. Furthermore, all other USB hubs worked on the Teensy. As it turns out, these weren’t the most helpful assumptions to make when finding the bug.
Any protocol analyzer can be used, for instance the Beagle480. The way it works is by passing through USB communication, making a copy of the communication coming in and out, and sending it to the PC.
Normally, the analyzer has a small buffer memory and must sustain fast data flow. Unfortunately, this can occasionally cause software lockup. From what could be gathered from the verbose printing, USB descriptors were found for the hub. As it turns out, the faulty hub was a Multi-TT type hub, while most others are single TT (transaction translator).
Fixing Software Lockup
Since it was necessary to get the rest of the descriptor data, fixing the software lockup was the next step. Writing in a panic function – a breakpoint of sorts – into the code allowed the USB host’s power to terminate, and stepping through the program revealed that while the 2 port hub was initially being read, some issue arose afterwards.
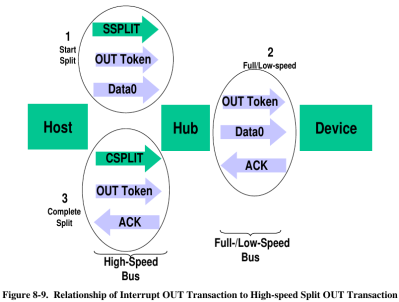
As it turns out, the issue relied on USB split transactions, used only between USB hosts and hubs. Communication happens by tokens, which begins with a SPLIT-START token.
As it turns out, the issue was that the tokens weren’t being sent in the correct order. The other hubs seemed to be handle this nevertheless. By applying a fix to the C++ code of the bad hub, which had previously not been implementing the data structure for accessing register properly, the hub was able to work again.The hub appeared to be rejecting bad token, which was causing the issue in the first place.
All in all, while I’m sure this had to be a head scratching experience, at least it gives us some insight into the low-level design of USB communication.
We’ve all been there. When debugging a microcontroller project, we just want to put in a print statement to figure out what’s going on with the microcontroller in real time. However, advanced embedded programmers know that printf statements are verboten: they’re just too SLOW. While not fixing this plight entirely, [Atakan Sarioglu] has come up with a clever way to create readable debug messages with minimal runtime overhead.
[Atakan Sarioglu]’s innovation, called BigBug (Github), is a dynamically-generated codebook. The codebook translates abbreviated messages sent over serial (UART here) to longer-form human-readable messages. To generate the codebook, BigBug automatically parses your comments to create a lookup between an abbreviation and the long-form message. When you are running your program on the microcontroller, BigBug will translate the short codes to long messages in real-time as you send log/debug data over serial.
For example (not restricted to Arduino-only), if you write Serial.println("HW") //@BB[HW] Hello World!, BigBug will translate the received characters HW\n to Hello World!. In this simple example, the abbreviation uses 3 characters while the fully readable message uses 13 characters, for a savings of ~75% with no loss of clarity. More advanced usage lets you log data: Serial.println("DT 1 1") //@BB[DT] Today's Date is: {0}/{1} becomes Today's Date is 1/1. You can also use enumerated variables (last example could showToday's Date is Jan. 1 with the same print command).
In terms of real-world benefit, using a 115200 baud connection (with 8N1 encoding) this is 115200 bits per second /(8+1) bits per byte = 12800 bytes/sec = 1 byte every 80 microseconds. Sending 13 bytes of Hello World!\n (in a naive, blocking UART implementation) takes ~1 ms of CPU time. With the shortcode HW\n, it would take ~0.25 ms to send essentially the same message (then decoded by BigBug). Note that because this just operates on serial data, BigBug is language independent
If you are used to coding with almost any modern tool except the Arduino IDE, you are probably accustomed to having on-chip debugging. Sometimes having that visibility inside the code makes all the difference for squashing bugs. But for the Arduino, most of us resort to just printing print statements in our code to observe behavior. When the code works, we take the print statements out. [JoaoLopesF] wanted something better. So he created an Arduino library and a desktop application that lets you have a little better window into your program’s execution.
To be honest, it isn’t really a debugger in the way you normally think of it. But it does offer several nice features. The most rudimentary is to provide levels of messaging so you can filter out messages you don’t care about. This is sort of like a server’s log severity system. Some messages are warnings and some are informational, and some are verbose. You can select what messages to see.
In addition, the library timestamps the messages so you can tell how much time elapsed between messages and what function you were in during the message. It can also examine and set global variables that you preconfigure and set watches on variables. It is also possible to call functions from the serial monitor.
There’s a companion Java program (see video below) although you can use most of the features directly from the normal serial monitor, it just isn’t as pretty. The Java program can also read an Arduino program file and convert all the print calls in it to use the library, if you like.
As you might expect, this requires some cooperation from your program. You have to set up the library and the serial port. You also have to arrange for the main function to run frequently (for example, in the main loop). By default, the debugging is mostly suppressed (although you can change that). You have to issue a serial port command to turn on higher level logging and debug functions.
If you start with the examples that come with the library (use the simple one for an AVR-based Arduino and the advanced one for any others), you’ll see a few #defines you can use to control the library:
DEBUG_DISABLED – Set to true and the library compiles out with no overhead
DEBUG_DISABLE_DEBUGGER – Turn off everything but message logging
DEBUG_INITIAL_LEVEL – Starting level of debug messages
DEBUG_USE_FLASH_F – Store debug messages in flash memory
There’s really two versions of the code: one for 8-bit AVR processors and another for other Arduino types. We found problems building both of them. The files src/utility/Fields.cpp, src/utility/Vector.h, and
src/utility/Util.cpp refer to arduino.h. That works on computers that have case-insensitive file systems. In each case, for Linux, it needs to be Arduino.h. In addition, SerialDebug.cpp is lacking a stdarg.h include. We’ve reported both of these issues to the developer so they may be fixed by now.
You can explore the video and the documentation to see how it all works. Is it a full-blown debugger? No. You can’t stop execution (odd, because you certainly could technically), set breakpoints, or single step. But it still useful to have access to at least some of your program’s internal state.
I’ve always appreciated simulation tools. Sure, there’s no substitute for actually building a circuit but it sure is handy if you can fix a lot of easy problems before you start soldering and making PCBs. I’ve done quite a few posts on LTSpice and I’m also a big fan of the Falstad simulator in the browser. However, both of those don’t do a lot for you if a microcontroller is a major part of your design. I recently found an open source project called Simulide that has a few issues but does a credible job of mixed simulation. It allows you to simulate analog circuits, LCDs, stepper and servo motors and can include programmable PIC or AVR (including Arduino) processors in your simulation.
The software is available for Windows or Linux and the AVR/Arduino emulation is built in. For the PIC on Linux, you need an external software simulator that you can easily install. This is provided with the Windows version. You can see one of several videos available about an older release of the tool below. There is also a window that can compile your Arduino code and even debug it, although that almost always crashed for me after a few minutes of working. As you can see in the image above, though, it is capable of running some pretty serious Arduino code as long as you aren’t debugging.
Looks and sounds exciting, right? It is, but be sure to save often. Under Linux, it seems to crash pretty frequently even if you aren’t debugging. It also suffers from other minor issues like sometimes forgetting how to move components. Saving, closing the application, and reopening it seems to fix that. Plus, we assume they will squash bugs as they are reported. One of my major hangs was solved by removing the default (old) Arduino IDE and making sure the most recent was on the path. But the crashing was frequent and seemed more or less random. It seemed that I most often had crashes on Linux with occasional freezes but on Windows it would freeze but not totally crash.
Basic Operation
The basic operation is pretty much what you’d expect. The window is broadly divided into three panes. The leftmost pane shows, by default, a palette of components. You can use the vertical tab strip on the left to also pick a memory viewer, a property inspector, or a file explorer.
The central pane is where you can draw your circuit and it looks like a yellow piece of engineering paper with a grid. Along the top are file buttons that do things like save and load files.
You’ll see a similar row of buttons above the rightmost pane. This is a code editor and debugging window that can interface with the Arduino IDE. It looks like it can also interface with GCBasic for the PIC, although I didn’t try that.
You drag components from the left onto the circuit. Wiring isn’t a distinct operation. You just let the mouse float over the connection until the cursor makes a cross. Click and then drag to the connection point and click again. Sometimes the program forgets to make the cross cursor and then I’ve had to save and restart.
Most of the components are just what you think they are. There are some fun ones including a keypad, an LED matrix, text and graphic LCDs, and even stepper and servo motors. You’ll also find several logic functions, 7400-series ICs, and there are annotation tools like text and boxes at the very bottom. You can right click on a category and hide components you never want to see.
At the top, you can add a voltmeter, an ammeter, or an oscilloscope to your circuit. The oscilloscope isn’t that useful because it is small. What you really want to do is use a probe. This just shows the voltage at some point but you can right click on it and add the probe to the plotter which appears at the bottom of the screen. This is a much more useful scope option.
There are a few quirks with the components. The voltage source has a push button that defaults to off. You have to remember to turn it on or things won’t work well. The potentiometers were particularly frustrating. The videos of older versions show a nice little potentiometer knob and that appears on my Windows laptop, too. On Linux the potentiometer (and the oscilloscope controls) look like a little tiny joystick and it is very difficult to set a value. It is easier to right click and select properties and adjust the value there. Just note that the value won’t change until you leave the field.
Microcontroller Features
If that’s all there was to it, you’d be better off using any of a number of simulators that we’ve talked about before. But the big draw here is being able to plop a microcontroller down in your circuit. The system provides PIC and AVR CPUs that are supported by the simulator code it uses. There’s also four variants of Arduinos: the Uno, Nano, Duemilanove, and the Leonardo.
You can use the built-in Arduino IDE — just make sure you have the real Arduino software on your path and it is a recent version. Also, unlike the real IDE, it appears you must save your file before a download or debug will notice the changes. In other words, if you make a change and download, you’ll compile the code before the change if you didn’t save the file first. You don’t have to use the built-in IDE. You can simply right click on the processor and upload a hex file. Recent Arduino IDEs have an option to export a hex file, and that works with no problem.
When you have a CPU in your design, you can right click it and open a serial monitor port which shows virtual serial output at the bottom of the screen and lets you provide input.
The debugging mode is simple but works until it crashes. Even without debugging, there is an option to the left of the screen to watch memory locations and registers inside the CPU.
Overall, the Arduino simulation seemed to work quite well. Connecting to the Uno pins was a little challenging at certain scales and I accidentally wired to the wrong pin on more than one occasion. One thing I found odd is that you don’t need to wire the voltage to the Arduino. It is powered on even if you don’t connect it.
Besides the crashing, the other issue I had was with the simulation speed which was rather slow. There’s a meter at the top of the screen that shows how slow the simulation is compared to real-time and mine was very low (10% or so) most of the time. There is a help topic explaining that this depends if you have certain circuit elements and ways to improve the run time, but it wasn’t bad enough that I bothered to explore it.
My first thought was that it would be difficult to handle a circuit with multiple CPUs in it since the debugging and serial monitors are all set up for a single CPU. However, as the video below shows, you can run multiple instances of the program and connect them via a serial port connection. The only issue would be if you had a circuit where both CPUs were interfacing with interrelated circuitry (for example, an op amp summing two signals, one from each CPU).
A Simple Example
As an experiment, I created a simple circuit that uses an Uno. It generates two PWM signals, integrates them with an RC circuit and then either drives a load or drives a load through a bipolar emitter follower. A pot lets you set the PWM percentages which are compliments of each other (that is, when one is at 10% the other is at 90%). Here’s the circuit:
Along with the very simple code:
int v;

const int potpin=0;
const int led0=5;
const int led1=6;

void setup() {
Serial.begin(9600);
Serial.println("Here we go!");
}

void loop() {
int v=analogRead(potpin)/4;
Serial.println(v);
analogWrite(led0,v);
analogWrite(led1,255-v);
delay(250);
}
Note that if the PWM output driving the transistor drops below 0.7V or so, the transistor will shut off. I deliberately didn’t design around that because I wanted to see how the simulator would react. It correctly models this behavior.
There’s really no point to this other than I wanted something that would work out the analog circuit simulation as well as the Arduino. You can download all the files from GitHub, including the hex file if you want to skip the compile step.
If you use the built-in IDE on the right side of the screen, then things are very simple. You just download your code. If you build your own hex file, just right click on the Arduino and you’ll find an option to load a hex file. It appears to remember the hex file, so if you run a simulation again later, you don’t have to repeat that step unless you moved the hex file.
However, the IDE doesn’t remember settings for the plotter, the voltage switches, or the serial terminal. You’ll especially want to be sure the 5V power switch above the transistor is on or that part of the circuit won’t operate correctly. You can right click on the Arduino to open the serial monitor and right click on the probes to bring back the plotter pane.
The red power switch at the top of the window will start your simulation. The screenshots above show close-ups of the plot pane and serial monitor.
Lessons Learned
This could be a really great tool if it would not crash so much. In all fairness, that could have something to do with my PC, but I don’t think that fully accounts for all of them. However, the software is still in pretty early development, so perhaps it will get better. There are a lot of fit and finish problems, too. For example, on my large monitor, many of the fonts were too large for their containers, which isn’t all that unusual.
The user interface seemed a little clunky, especially when you had to manipulate potentiometers and switches. Also, remember you can’t right-click on the controls but must click on the underlying component. In other words, the pot looks like a knob on top of a resistor. Right clicks need to go on the resistor part, not the knob. I also was a little put off that you can’t enter multiplier suffixes directly in component values. That is, you can’t enter a resistor value as 1K. You can enter 1000 or you can enter 1 and then change the units in a separate field to Kohms. But that’s not a big deal. You can get used to all of that if it would quit crashing.
I really wanted the debugging feature to work. While you can debug directly with simuavr or other tools, you can’t easily simulate all your I/O devices like you can with this tool. I’m hoping that becomes more robust in the future. Under Linux it would work for a bit and crash. On Windows, I never got it to work.
As I always say, though, simulation is great, but the real world often leads to surprises that don’t show up in simulation. Still, a simulation can help you clear up a host of problems before you commit to heating up the soldering iron or pulling out the breadboard. Simuide has the potential to be a great tool for simulating the kind of designs we see most on Hackaday.
If you want to explore other simulation options, we’ve talked a lot about LTSpice, including our Circuit VR series. There’s also the excellent browser-based Falstad simulator.
In proper, high-dollar embedded development environments – and quite a few free and open source ones, as well – you get really cool features like debugging, emulation, and profiling. The Arduino IDE doesn’t feature any of these bells a whistles, so figuring out how much time is spent in one section of code is nigh impossible. [William] came up with a clever solution to this problem, and while it doesn’t tell you exactly how much time is spent on a specific line of code, it’s still a good enough tool to be a great help in optimization.
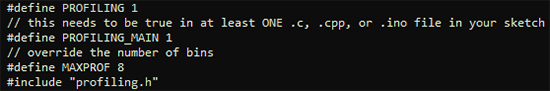
[William]‘s solution is to create a ‘bin’ for arbitrary chunks of code – one for each subroutine or deeply nested loop. When the profiler run, you end up with a histogram of how much time is spent per block of code. This is done with an interrupt that runs at about 1 kHz, with macros sprinkled around the code. Each time the interrupt ticks, the macro runs and increases a counter by one. Let the sketch run for a minute or so, and you get an idea of how much time is spent in a specific area of code.
It’s a bit of a kludge, but when you’re dealing with extremely minimal tools, any sort of help in debugging is sorely needed and greatly appreciated.
A serial monitor is an easy way to debug your projects. As we step through code, it’s nice to see a “Hey! I’m working, moving to next thing!” across the monitor, and not so nice to see nothing – the result of a bug that needs debugging. This has always meant needing a PC loaded with your favorite serial terminal program close at hand.
Most of the time this is not an issue, because the PC is used to compile the code and program the project at hand. But what if you’re in the field, with a mission of fixing a headless system, and in need a serial monitor? Why lug around your PC when you can make your own External Serial Monitor!
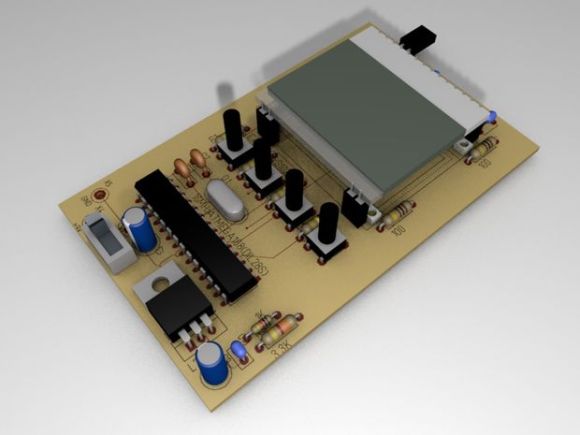
[ARPix] built this fully functional serial monitor based on an Atmega328 and a 102 x 64 LCD display. While it doesn’t have a keyboard port like this microcontroller based serial terminal, tact switches allow access to the user interface to start and stop the reading and set the baud rate. The Atmega328 has 2K of SRAM, which is needed for the project. Apparently, 1K was not enough to handle all the data. All code, schematics and a very well done parts layout are available, making this sure to be your next weekend project!
Planet Arduino is, or at the moment is wishing to become, an aggregation of public weblogs from around the world written by people who develop, play, think on Arduino platform and his son. The opinions expressed in those weblogs and hence this aggregation are those of the original authors. Entries on this page are owned by their authors. We do not edit, endorse or vouch for the contents of individual posts. For more information about Arduino please visit www.arduino.cc
You are currently browsing the archives for the debugging category.