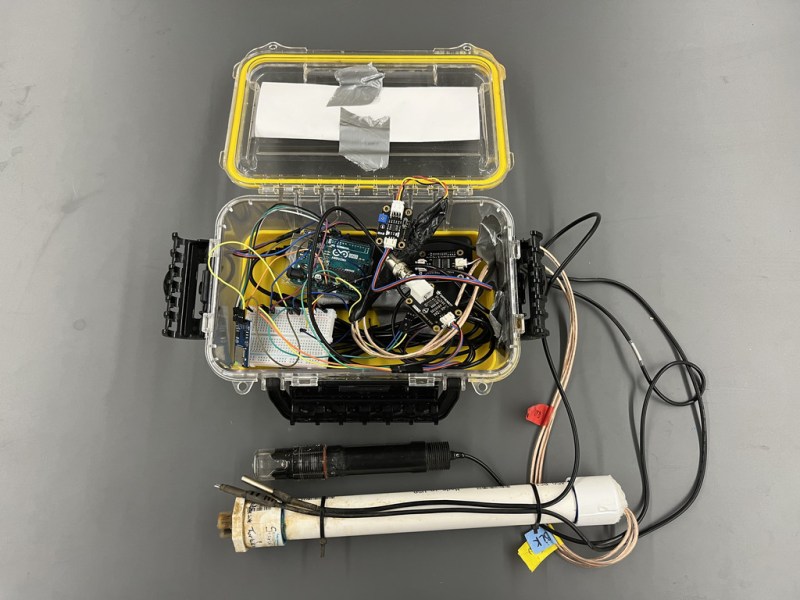
While it can be straightforward to distill water to high purity, this is rarely the best method for producing water for useful purposes. Even drinking water typically needs certain minerals in it, plants may need a certain pH, and wastewater systems have a whole host of other qualities that need to be measured. Measuring water quality is a surprisingly complex endeavor as a result and often involves a wide array of sensors, much like this water quality meter from [RowlesGroupResearch].
The water quality meters that they are putting to use are typically set up in remote locations, without power, and are targeting natural bodies of water and also wastewater treatment plants. Temperature and pH are simple enough to measure and grasp, but this device also includes sensors for total dissolved solids (TDS) and turbidity which are both methods for measuring various amounts and types of particles suspended in the water. The build is based around an Arduino so that it is easy for others to replicate, and is housed in a waterproof box with a large battery, and includes data logging to an SD card in order to make it easy to deploy in remote, outdoor settings and to gather the data at a later time.
The build log for this device also goes into detail about all of the steps needed to set this up from scratch, as well as a comprehensive bill of materials. This could be useful in plenty of professional settings such as community wastewater treatment facilities but also in situations where it’s believed that industrial activity may be impacting a natural body of water. For a water quality meter more focused on drinking water, though, we’d recommend this build that is trained on its own neural network.
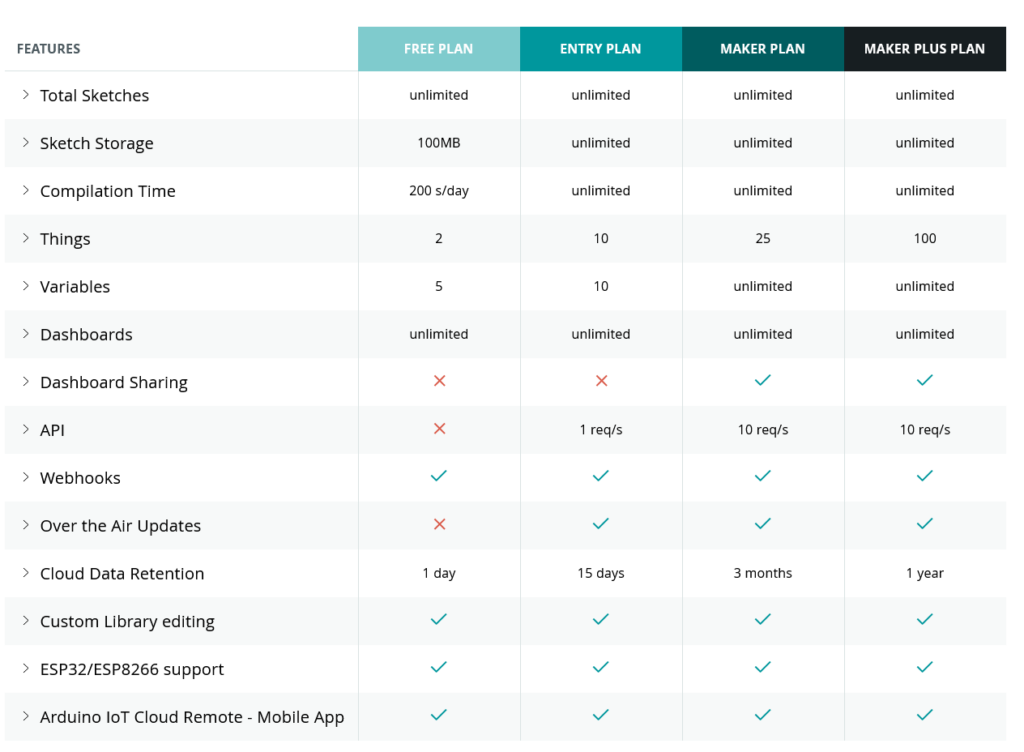
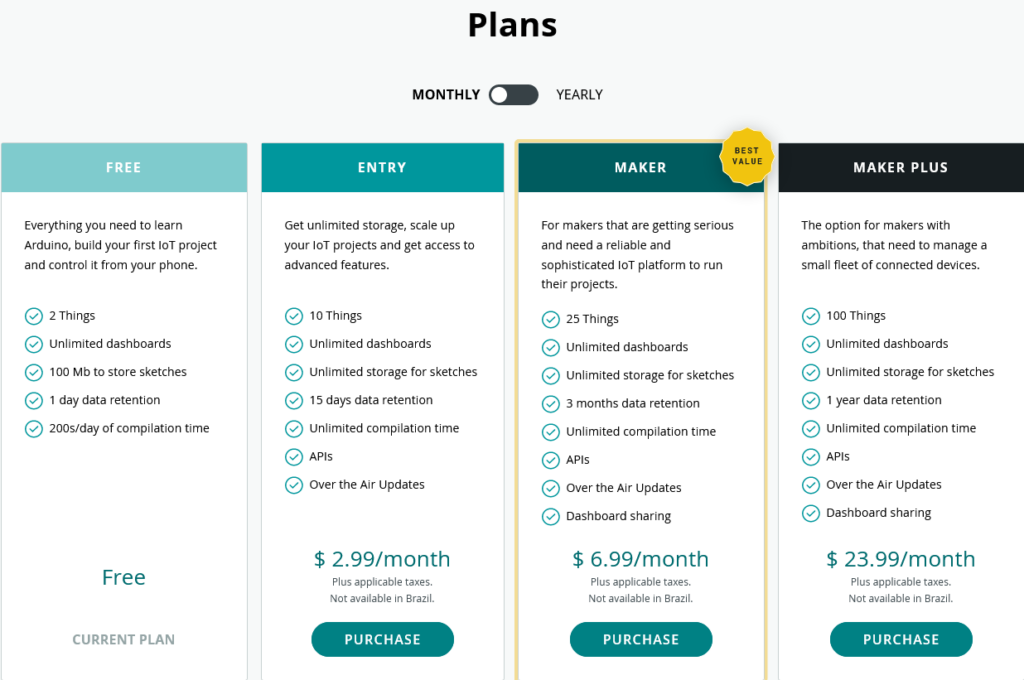
Historical data can be essential to making your electronics and Arduino project work how you want them to. Data retention is one of the features that changes depending on which level of Arduino Cloud account you have. Here’s everything you need to know, so you can choose exactly the right Arduino Cloud plan.
Hang on though. Aren’t we here to talk about data retention?
Indeed we are. When we say “variables”, this is the term used to describe the data you send to your Arduino Cloud. It sounds a bit technical, but consider the word. “Variable” actually makes more sense than “data”, which is kinda woolly.
Variables are information that changes or, you guessed it, varies. Temperature, for example. If you have a temperature sensor sending data to the Cloud, it’s a variable. Because the value of the data (the temperature) is always changing/varying.
So in your sketch it’s known as a variable. The different data retention options in the Arduino Cloud plans tell you how long the Cloud will store a record of those variables for you.
Historical Data Options
Each Arduino Cloud plan offers a different length of time for how long you retain sensor data, depending on your needs.
If you’re running a home automation to turn the lights on when it drops dark, your system is working with (pretty much) real-time data. So 24 hours of sensor information is perfectly adequate. It’s not like you’ll be turning a lamp on or off based on yesterday’s ambient light levels.
A weather station might work a bit differently though. If you’re measuring the temperature or rainfall or daylight hours, you may want to build a comparison to see how the weather is changing. In this case, an Arduino Cloud Entry plan would give you 15 days of data, allowing you to monitor and record recent changes in your weather station’s variables.
Historical data for an IoT greenhouse, or maybe an aquarium or terrarium, would be much more important. Maybe it’s even an industrial project that’s monitoring equipment for predictive maintenance needs. In these cases, being able to look back at your variables over previous weeks and months could be essential. In that case, you’d go Maker or Maker Plus, so you can build dashboards with detailed histories of your measurements.
It’s very possible that you don’t even know how much historical data will be useful to your project at first. You start on the free tier, decide that it’d be useful to have legacy information, and go up through the Entry plan and eventually settle on Maker. The project leads the way, until it’s delivering everything you need.
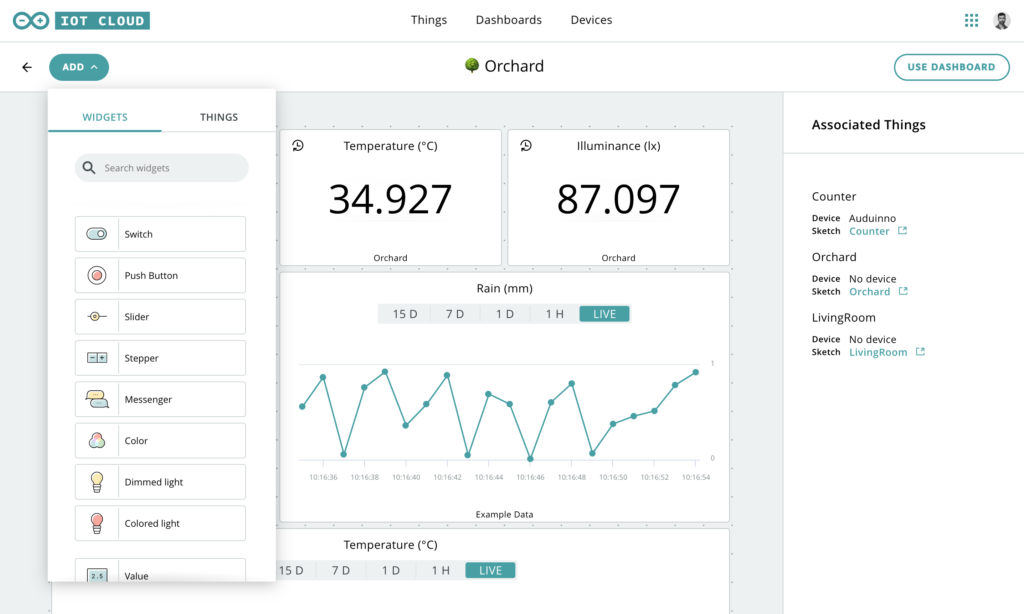
Putting Historical Data to Use in Arduino Cloud
Arduino Cloud is really clever when it comes to the data generated by sensors and used as variables. For example, you can specify how often new data is sent to your Arduino Cloud.
Let’s say you’re monitoring Wi-Fi signal strength at the bottom of the garden, where a project (weather station, let’s say) is installed. If this is a solar and/or battery powered device, power consumption becomes essential. By changing the data sampling interval from updating a variable on Arduino Cloud every second to updating once a minute, you can extend battery life by a huge amount. The device is only operating a fraction of the time it was before, and the information is just as useful.
Combined with 15 days or three months of historical data, you can build a detailed picture of Wi-Fi performance that lets you keep everything running perfectly. Or, if you need to find out when and why your signal has been dropping, the story is right there in your Arduino Cloud dashboard.
Choosing the Right Arduino Cloud Plan
So for all these reasons, you can see why different amounts of data retention are available in the Arduino Cloud plans. It’s not that all projects benefit from as much retention as possible. As we discussed, even some complex, elaborate projects barely need any. Others, which might be simple signal strength monitoring or rainfall measurement, need to know what was happening months ago.
You have the choice, because the different Arduino Cloud plans offer different historical data options for different needs. If in doubt for what your project needs to work as intended, start on the free plan and work up from there.
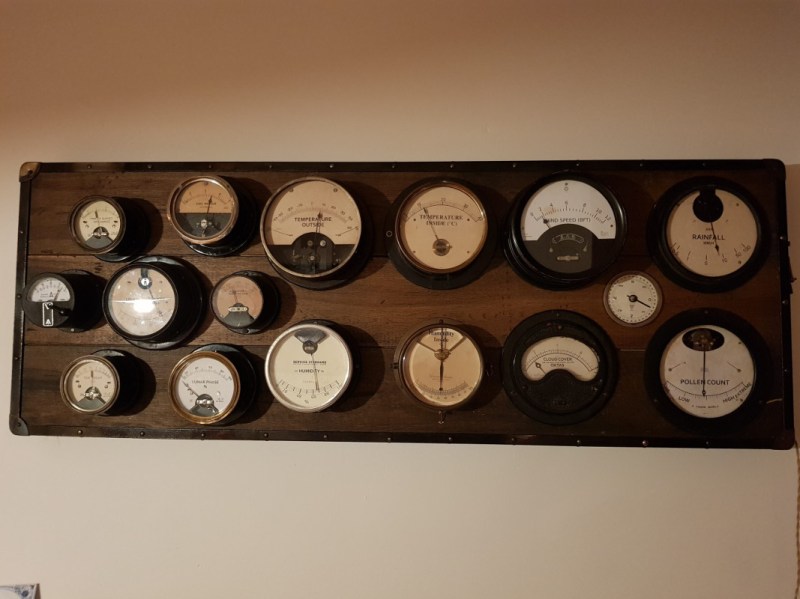
For most of us, getting weather information is as trivial as unlocking a smartphone or turning on a computer and pointing an app or browser at one’s weather site of choice. This is all well and good, but it lacks a certain panache that old weather stations had with their analog dials and stained wood cases. The weather station that [BuildComics] created marries both this antique aesthetic with modern weather data availability, and then dials it up a notch for this enormous analog weather station build.
The weather station uses 16 discrete dials, each modified with a different label for the specific type of data displayed. Some of them needed new glass, and others also needed coils to be modified to be driven with a lower current than they were designed as well, since each would be driven by one of two Arduinos in this project. Each are tied to a microcontroller output via a potentiometer which controls the needle’s position for the wildly different designs of meter. The microcontrollers themselves get weather information via the internet, which allows for about as up-to-date information about the weather as one could gather first-hand.
The amount of customization of these old meters is impressive, and what’s even more impressive is the project’s final weight. [BuildComics] reports that it took two people just to lift it onto the wall mount, which is not surprising given the amount of iron in some of these old analog meters. And, although not as common in the real world anymore, these old antique meters have plenty of repurposed uses beyond weather stations as well.
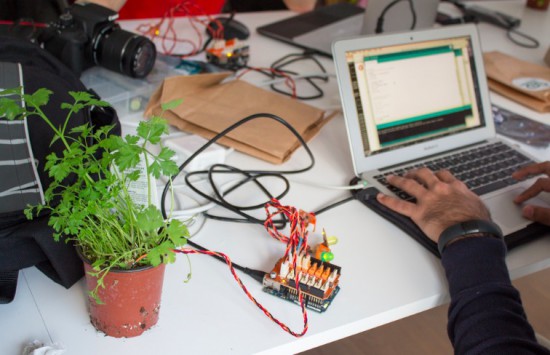
I met John Kuiphoff a couple years ago and was blown away by some very clever data visualizations he shared based on people’s youtube channels. John’s back, and this time with another very creative approach to data visualization. In this project, John is wanting to display how much sunlight hits […]
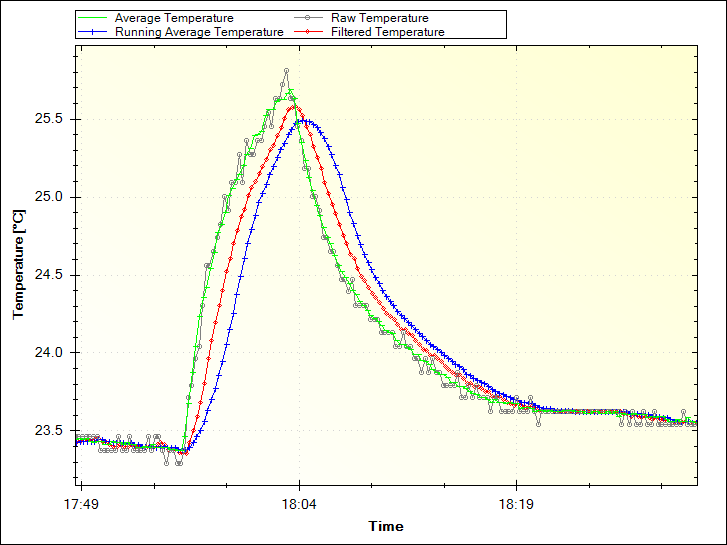
Increasing accuracy in the collection of data coming from sensors is a need that, sooner or later, Makers need to face. Paul Martinsen from MegunoLink created a tutorial to eliminate noise from sensor readings on Arduino with three simple filtering techniques.
The Averaging and Running Average techniques are easy to implement as they work by adding a number of measurements together, then dividing the total by the number of measurements. In both cases, the downside is that it can use a lot of memory.
The Exponential filter is a better solution for several reasons: it doesn’t require much memory, you can control how much filtering is applied with a single parameter, and it saves battery power because you don’t need to make many measurements at once. For this solution, they developed an Arduino filter library so you don’t need to go mad with math!
Being new to Arduino I was a bit overwhelmed by the different ways to do things. So this is what I came up with!
I am using an Arduino UNO R3 clone but the connections I believe are the same for most Arduino’s or can be easily modified for your particular model. This project is the beginning of a UROV that I am building from the ground up and this is my first attempt to work with Arduino. I do not want to turn my UNO into a webserver if I can avoid it because of the shortage of memory and this project is just a few of the sensors that I want to use for my project. I am going to start out by using the premise that my project will eventually use RS485 to communicate serially from my UNO to the PC via a tether.
This is the story of a group of college students who moved to the Mojave Desert, bought a house, painted it white, and turned it into a make-shift lab. Then they went out to launch rockets.
It’s 2014 and the Internet-of-Things is flying along at a rapid rate with all sorts of services and devices that share data and allow control via the Internet. In the spirit of this we look a new service called plotly.
This is a “collaborative data analysis and graphing tool” which allows you to upload your own data to be analysed in many ways, and then graph the results using all sorts of plot types.
With plotly you can run your own mathematical functions over your data, run intense statistical analysis and use or edit one of the many APIs (Python, MATLAB, R, Julia, REST, Arduino, or Perl) to increase the level of customisation. Plotly works in conjunction with Google Drive to store your data, however this can be exported and imported without any issues. Futhermore plotly works best in Google Chrome.
For our review we’ll look at using plotly to quickly display and analyse data received from an Internet-connected Arduino – our EtherTen, or you can use almost any Arduino and Ethernet shield. The system isn’t completely documented however by revieiwng our example sketch and some experimenting with the interface plotly is very much usable, even in its current beta format.
Getting started with plotly
You will need to setup a plotly account, and this is simply accomplished from their main site. Some of you may be wondering what plotly costs – at the time of writing plotly is free for unlimited public use (that is – anyone can see your data with the right URL), but requires a subscription for extended private use. You can find the costs at the plans page.
Once you have a plotly account, visit your plotly home page, whose URL is https://plot.ly/~yourusername/# – then click “edit profile”. Another window will appear which amongst other things contains your plotly API key – make a note of this as you will need it and your username for the Arduino sketch.
Next, you’ll need some Arduino or compatible hardware to capture the data to log and analyse. An Arduino with an Ethernet or WiFi connection, and appropriate sensors for your application. We have our EtherTen that takes readings from a temperature/humidity sensor and a light level sensor:
Now you need a new Arduino library, which is available from the plotly API page. Lots of APIs there… Anyhow, click “Arduino” and you will arrive at the github page. Download the entire .zip file, and extract the plotly_ethernet folder into Arduino libraries folder which in most installations can be found at ..Arduino-1.0.xlibraries.
Finally we’ll use a demonstration sketch provided by plotly and modify this to our needs, which can be downloaded from github. We’ll go through this sketch and show you what to update – so have a quick look and then at out example sketch at the end of this section.
First, insert any code required to get data from your sensors and store the data in a variable – do this so the values can be used in void loop. Next, update the MAC address and the IP address of your Ethernet-enabled Arduino with the following lines:
and change the MAC and IP if necessary. If Arduino and Ethernet is new to you, check out the tutorial. Now look for the following two lines and enter your plotly username and API key:
You can find a list of time zones available for use with plotly here. Now you need to determine how many traces and points to use. A trace is one source of data, for example temperature. For now you will have one point, so set these parameters using the following lines:
int nTraces=x; // x = number of traces
int nPoints=1;
For example, we will plot temperature, humidity and light level – so this requires three traces. The next step is to set the filename for the plot, using the following line:
char filename[] = "simple_example";
This will be sent to plotly and your data will be saved under that name. At the point in your sketch where you want to send some data back to plotly, use:
where data is the variable to send back to plotly. We use millis() as our example is logging data against time.
To put all that together, consider our example sketch with the hardware mentioned earlier:
// Code modified from example provied by plot.ly

#include <SPI.h>
#include <Ethernet.h>
#include "plotly_ethernet.h"
#include "DHT.h"

// DHT Sensor Setup
#define DHTPIN 2               // We have connected the DHT to Digital Pin 2
#define DHTTYPE DHT22          // This is the type of DHT Sensor (Change it to DHT11 if you're using that model)
DHT dht(DHTPIN, DHTTYPE);      // Initialize DHT object
plotly plotly;                 // initialize a plotly object, named plotly

//initialize plotly global variables
char layout[]="{}";
char filename[] = "Office Weather and Light"; // name of the plot that will be saved in your plotly account -- resaving to the same filename will simply extend the existing traces with new data

float h, t, ll;
int lightLevel;

// Ethernet Setup
byte mac[] = { 0xDE, 0xAD, 0xBE, 0xEF, 0xFE, 0xED }; // doesn't really matter
byte my_ip[] = { 192, 168, 1, 77 }; // google will tell you: "public ip address"

void startEthernet(){
  Serial.println("Initializing ethernet");
  if(Ethernet.begin(mac) == 0){
    Serial.println("Failed to configure Ethernet using DHCP");
    // no point in carrying on, so do nothing forevermore:
    // try to congifure using IP address instead of DHCP:
    Ethernet.begin(mac, my_ip);
  }
  Serial.println("Done initializing ethernet");
  delay(1000);
}

void setup() {
  // Open serial communications and wait for port to open:
  Serial.begin(9600);
  while (!Serial) {
    ; // wait for serial port to connect. Needed for Leonardo only
  }

  dht.begin(); // initialize dht sensor reading
  startEthernet();    // initialize ethernet

    // Initialize plotly settings
  plotly.VERBOSE = true; // turn to false to suppress printing over serial
  plotly.DRY_RUN = false; // turn to false when you want to connect to plotly's servers
  plotly.username = "yourplotlyusername"; // your plotly username -- sign up at https://plot.ly/ssu or feel free to use this public account. password of the account is "password"
  plotly.api_key = "yourplotlyapikey"; // "public_arduino"'s api_key -- char api_key[10]
  plotly.timestamp = true; // tell plotly that you're stamping your data with a millisecond counter and that you want plotly to convert it into a date-formatted graph
  plotly.timezone = "Australia/Melbourne"; // full list of timezones is here:https://github.com/plotly/arduino-api/blob/master/Accepted%20Timezone%20Strings.txt
}

void loop()
{
  // gather data to plot
  h = dht.readHumidity(); // read humitidy from DHT pin
  t = dht.readTemperature();
  lightLevel = analogRead(A5);
  ll = lightLevel / 100; // reduce the value from the light sensor

  // Open the Stream
  plotly.open_stream(1, 3, filename, layout); // plotlystream(number_of_points, number_of_traces, filename, layout)

  plotly.post(millis(),t); // post temperature to plotly (trace 1)
  delay(150);
  plotly.post(millis(),h); // post humidity to plotly (trace 2)
  delay(150);
  plotly.post(millis(),lightLevel); // post light sensor readout to plotly (trace 3)

  for(int i=0; i<300; i++)
  { // (once every five minutes)
    delay(1000);
  }
}
After wiring up the hardware and uploading the sketch, the data will be sent until the power is removed from the Arduino.
Monitoring sensor data
Now that your hardware is sending the data off to plotly, you can check it out in real time. Log into plotly and visit the data home page – https://plot.ly/plot – for example:
Your data file will be listed – so just click on the file name to be presented with a very basic graph. Over time you will see it develop as the data is received, however you may want to alter the display, headings, labels and so on. Generally you can click on trace labels, titles and so on to change them, the interface is pretty intuitive after a few moments. A quick screencast of this is shown in this video.
To view and analyse the raw data – and create all sorts of custom plots, graphs and other analysis – click the “view data in grid” icon which is the second from the left along the bar:
At which point your data will be displayed in a new tab:
From this point you can experiment to your heart’s content – just don’t forget to save your work. In a short amount of time your data can be presented visually and analysed with ease:
Conclusion
Although plotly is still in beta form, it works well and the developers are responsive to any questions – so there isn’t much more to say but give it a try yourself, doing so won’t cost you anything and you can see how useful plotly is for yourself. And if you enjoyed this article, or want to introduce someone else to the interesting world of Arduino – check out my book (now in a third printing!) “Arduino Workshop”.
Have fun and keep checking into tronixstuff.com. Why not follow things on twitter, Google+, subscribe for email updates or RSS using the links on the right-hand column, or join our forum – dedicated to the projects and related items on this website. Sign up – it’s free, helpful to each other – and we can all learn something.
In this chapter we will introduce and examine the use of Ethernet networking with Arduino over local networks and the greater Internet. It will be assumed that you have a basic understanding of computer networking, such as the knowledge of how to connect computers to a hub/router with RJ45 cables, what an IP and MAC address is, and so on. Furthermore, here is a good quick rundown about Ethernet.
Getting Started
You will need an Arduino Uno or compatible board with an Ethernet shield that uses the W5100 Ethernet controller IC (pretty much all of them):
…or consider using a Freetronics EtherTen – as it has everything all on the one board, plus some extras:
Furthermore you will need to power the board via the external DC socket – the W5100 IC uses more current than the USB power can supply. A 9V 1A plug pack/wall wart will suffice. Finally it does get hot – so be careful not to touch the W5100 after extended use. In case you’re not sure – this is the W5100 IC:
Once you have your Ethernet-enabled Arduino, and have the external power connected – it’s a good idea to check it all works. Open the Arduino IDE and selectFile > Examples > Ethernet > Webserver. This loads a simple sketch which will display data gathered from the analogue inputs on a web browser. However don’t upload it yet, it needs a slight modification.
You need to specify the IP address of the Ethernet shield – which is done inside the sketch. This is simple, go to the line:
IPAddress ip(192,168,1, 177);
And alter it to match your own setup. For example, in my home the router’s IP address is 10.1.1.1, the printer is 10.1.1.50 and all PCs are below …50. So I will set my shield IP to 10.1.1.77 by altering the line to:
IPAddress ip(10,1,1,77);
You also have the opportunity to change your MAC address. Each piece of networking equipment has a unique serial number to identify itself over a network, and this is normall hard-programmed into the equipments’ firmware. However with Arduino we can define the MAC address ourselves.
If you are running more than one Ethernet shield on your network, ensure they have different MAC addresses by altering the hexadecimal values in the line:
However if you only have one shield just leave it be. There may be the very, very, statistically rare chance of having a MAC address the same as your existing hardware, so that would be another time to change it.
Once you have made your alterations, save and upload the sketch. Now open a web browser and navigate to the IP address you entered in the sketch, and you should be presented with something similar to the following:
What’s happening? The Arduino has been programmed to offer a simple web page with the values measured by the analogue inputs. You can refresh the browser to get updated values.
At this point – please note that the Ethernet shields use digital pins 10~13, so you can’t use those for anything else. Some Arduino Ethernet shields may also have a microSD card socket, which also uses another digital pin – so check with the documentation to find out which one.
Nevertheless, now that we can see the Ethernet shield is working we can move on to something more useful. Let’s dissect the previous example in a simple way, and see how we can distribute and display more interesting data over the network. For reference, all of the Ethernet-related functions are handled by the Ethernet Arduino library. If you examine the previous sketch we just used, the section that will be of interest is:
 for (int analogChannel = 0; analogChannel < 6; analogChannel++)
          {
            int sensorReading = analogRead(analogChannel);
            client.print("analog input ");
            client.print(analogChannel);
            client.print(" is ");
            client.print(sensorReading);
            client.println("<br />");
          }
          client.println("</html>");
Hopefully this section of the sketch should be familiar – remember how we have used serial.print(); in the past when sending data to the serial monitor box? Well now we can do the same thing, but sending data from our Ethernet shield back to a web browser – on other words, a very basic type of web page.
However there is something you may or may not want to learn in order to format the output in a readable format – HTML code. I am not a website developer (!) so will not delve into HTML too much.
However if you wish to serve up nicely formatted web pages with your Arduino and so on, here would be a good start. In the interests of simplicity, the following two functions will be the most useful:
client.print(" is ");
Client.print (); allows us to send text or data back to the web page. It works in the same way as serial.print(), so nothing new there. You can also specify the data type in the same way as with serial.print(). Naturally you can also use it to send data back as well. The other useful line is:
client.println("<br />");
which sends the HTML code back to the web browser telling it to start a new line. The part that actually causes the carriage return/new line is the <br /> which is an HTML code (or “tag”) for a new line. So if you are creating more elaborate web page displays, you can just insert other HTML tags in the client.print(); statement. If you want to learn more about HTML commands, here’s a good tutorial site. Finally – note that the sketch will only send the data when it has been requested, that is when it has received a request from the web browser.
Accessing your Arduino over the Internet
So far – so good. But what if you want to access your Arduino from outside the local network?
You will need a static IP address – that is, the IP address your internet service provider assigns to your connection needs to stay the same. If you don’t have a static IP, as long as you leave your modem/router permanently swiched on your IP shouldn’t change. However that isn’t an optimal solution.
If your ISP cannot offer you a static IP at all, you can still move forward with the project by using an organisation that offers a Dynamic DNS. These organisations offer you your own static IP host name (e.g. mojo.monkeynuts.com) instead of a number, keep track of your changing IP address and linking it to the new host name. From what I can gather, your modem needs to support (have an in-built client for…) these DDNS services. As an example, two companies are No-IP andDynDNS.com. Please note that I haven’t used those two, they are just offered as examples.
Now, to find your IP address… usually this can be found by logging into your router’s administration page – it is usually 192.168.0.1 but could be different. Check with your supplier or ISP if they supplied the hardware. For this example, if I enter 10.1.1.1 in a web browser, and after entering my modem administration password, the following screen is presented:
What you are looking for is your WAN IP address, as you can see in the image above. To keep the pranksters away, I have blacked out some of my address.
The next thing to do is turn on port-forwarding. This tells the router where to redirect incoming requests from the outside world. When the modem receives such a request, we want to send that request to the port number of our Ethernet shield. Using the:
EthernetServer server(125);
function in our sketch has set the port number to 125. Each modem’s configuration screen will look different, but as an example here is one:
So you can see from the line number one in the image above, the inbound port numbers have been set to 125, and the IP address of the Ethernet shield has been set to 10.1.1.77 – the same as in the sketch.
After saving the settings, we’re all set. The external address of my Ethernet shield will be the WAN:125, so to access the Arduino I will type my WAN address with :125 at the end into the browser of the remote web device, which will contact the lonely Ethernet hardware back home.
Furthermore, you may need to alter your modem’s firewall settings, to allow the port 125 to be “open” to incoming requests. Please check your modem documentation for more information on how to do this.
Now from basically any Internet connected device in the free world, I can enter my WAN and port number into the URL field and receive the results. For example, from a phone when it is connected to the Internet via LTE mobile data:
So at this stage you can now display data on a simple web page created by your Arduino and access it from anywhere with unrestricted Internet access. With your previous Arduino knowledge (well, this is chapter sixteen) you can now use data from sensors or other parts of a sketch and display it for retrieval.
Displaying sensor data on a web page
As an example of displaying sensor data on a web page, let’s use an inexpensive and popular temperature and humidity sensor – the DHT22. You will need to install the DHT22 Arduino library which can be found on this page. If this is your first time with the DHT22, experiment with the example sketch that’s included with the library so you understand how it works.
Connect the DHT22 with the data pin to Arduino D2, Vin to the 5V pin and GND to … GND:
Now for our sketch – to display the temperature and humidity on a web page. If you’re not up on HTML you can use online services such as this to generate the code, which you can then modify to use in the sketch.
In the example below, the temperature and humidity data from the DHT22 is served in a simple web page:
#include <SPI.h>
#include <Ethernet.h>

// for DHT22 sensor
#include "DHT.h"
#define DHTPIN 2
#define DHTTYPE DHT22

// Enter a MAC address and IP address for your controller below.
// The IP address will be dependent on your local network:
byte mac[] = {   0xDE, 0xAD, 0xBE, 0xEF, 0xFE, 0xED };
IPAddress ip(10,1,1,77);

// Initialize the Ethernet server library
// with the IP address and port you want to use
// (port 80 is default for HTTP):
EthernetServer server(125);
DHT dht(DHTPIN, DHTTYPE);

void setup()
{
  dht.begin();
 // Open serial communications and wait for port to open:
  Serial.begin(9600);
   while (!Serial) {
    ; // wait for serial port to connect. Needed for Leonardo only
  }
  // start the Ethernet connection and the server:
  Ethernet.begin(mac, ip);
  server.begin();
  Serial.print("server is at ");
  Serial.println(Ethernet.localIP());
}

void loop()
{
  // listen for incoming clients
  EthernetClient client = server.available();
  if (client) {
    Serial.println("new client");
    // an http request ends with a blank line
    boolean currentLineIsBlank = true;
    while (client.connected()) {
      if (client.available()) {
        char c = client.read();
        Serial.write(c);
        // if you've gotten to the end of the line (received a newline
        // character) and the line is blank, the http request has ended,
        // so you can send a reply
        if (c == 'n' && currentLineIsBlank)
        {
          // send a standard http response header
          client.println("HTTP/1.1 200 OK");
          client.println("Content-Type: text/html");
          client.println("Connection: close");  // the connection will be closed after completion of the response
	  client.println("Refresh: 30");  // refresh the page automatically every 30 sec
          client.println();
          client.println("<!DOCTYPE HTML>");
          client.println("<html>");

          // get data from DHT22 sensor
          float h = dht.readHumidity();
          float t = dht.readTemperature();
          Serial.println(t);
          Serial.println(h);

          // from here we can enter our own HTML code to create the web page
          client.print("<head><title>Office Weather</title></head><body><h1>Office Temperature</h1><p>Temperature - ");
          client.print(t);
          client.print(" degrees Celsius</p>");
          client.print("<p>Humidity - ");
          client.print(h);
          client.print(" percent</p>");
          client.print("<p><em>Page refreshes every 30 seconds.</em></p></body></html>");
          break;
        }
        if (c == 'n') {
          // you're starting a new line
          currentLineIsBlank = true;
        }
        else if (c != 'r') {
          // you've gotten a character on the current line
          currentLineIsBlank = false;
        }
      }
    }
    // give the web browser time to receive the data
    delay(1);
    // close the connection:
    client.stop();
    Serial.println("client disonnected");
  }
}
It is a modification of the IDE’s webserver example sketch that we used previously – with a few modifications. First, the webpage will automatically refresh every 30 seconds – this parameter is set in the line:
client.println("Refresh: 30"); // refresh the page automatically every 30 sec
… and the custom HTML for our web page starts below the line:
// from here we can enter our own HTML code to create the web page
You can then simply insert the required HTML inside client.print() functions to create the layout you need.
Finally – here’s an example screen shot of the example sketch at work:
You now have the framework to create your own web pages that can display various data processed with your Arduino.
Remote control your Arduino from afar
We have a separate tutorial on this topic, that uses the teleduino system.
Conclusion
So there you have it, another useful way to have your Arduino interact with the outside world. Stay tuned for upcoming Arduino tutorials by subscribing to the blog, RSS feed (top-right), twitter or joining our Google Group. And if you enjoyed the tutorial, or want to introduce someone else to the interesting world of Arduino – check out my book (now in a third printing!) “Arduino Workshop” from No Starch Press.
When the time comes to capture data from a microcontroller-based project, or control an embedded project via a PC – the thought of writing the appropriate PC software can give some people a headache. Or if you’re an Arduino or other development board user and are frustrated with the Serial Monitor box – where do you go? These problems and many more can be solved by using the Megunolink Pro software that’s the subject of this review.
From the Megunolink website,
MegunoLink Pro is a tool designed to aid embedded electronics designers. MegunoLink provides a set of tools to help visualize serial data, it is made up of a set of visualizers that each have a unique function and any number of them can be utilized at once. With these visualizers and our functional tabbed and docked interface you can create a full control center for your embedded project. Plot, log and monitor serial streams from both hardwired, bluetooth, and network based (UDP) devices.
The user interface allows for a completely customized layout with many different visualisers displaying information at once. Perfect for developing exciting new microcontroller based designs. Data streams go from hard to follow serial messages to easy to interpret tables and interactive plots. The interface panel allows you to set up custom GUI elements that let you take control of your device from the comfort of your PC screen.
Phil from Megunolink gives us a quick demonstration in the following video:
Installation
Getting Megunolink running takes around ten minutes. You’ll need a recent PC running Windows of some variety (XP/ 2003/Vista/Win7/8) and also .NET Framework v4.0. You can download a trial Pro version which operates for seven days – at which point you can use the “lite” version or purchase a Pro license. The Megunolink team have given our readers a discount on the personal version, use the coupon code “TROMLP” for 30% off.
Operation
Using Megunolink is quite simple, even though there’s a whole pile of functions. From the home page there’s a variety of documentation for all of the software features, so you can get started very quickly. You can simply capture all output from the serial line and have it saved to a text file (and with a time/date stamp, which removes the need for a RTC in the hardware) – something which seems quite simple but not done with the Arduino IDE:
Furthermore there is an “upload monitor” in Megunolink – which can automatically disconnect from the COM: port used by an Arduino when you need to upload a new sketch, then reconnect afterward. This saves a lot of to-and-fro between the two programs when adjusting code.
The key to analysing data from the microcontroller is to insert text notes in the serial output, which are then interpreted by Megunolink for display purposes. For example, if you have your MCU code send labels with the data, Megunolink can then sort these out into channels and graph the data, for example:
An example Arduino sketch is provided to demonstrate this, and it translates to other development platforms. Another great feature is the ability to create a graphical user interface for projects connected to the PCB. You design the GUI which can include buttons, sliders and numeric fields, for example:
… and each of which send values of your choice to the device via USB. Then it’s a simple matter of coding your device to respond to the serial commands.
Real-time mapping
As mentioned in the video above, there’s also mapping support – your hardware sends GPS coordinates and they’re displayed in a real-time window:
Arduino programming
There’s also an interface to allow programming of an Arduino with .hex files via Megunolink. Currently it can work with the ATmega328, -2560, and with an external programmer -328P and -644 microcontrollers.
Conclusion
Once again Megunolink has proven to be a useful piece of software. It gives you a friendly and powerful connection to all the data from your microcontroller, and also a simple GUI for control via serial. So test it for yourself, it won’t cost you anything for the trial version. And if you like it – don’t forget about the tronixstuff.com discount on the personal version - use the coupon code ”TROMLP” for 30% off. Finally, if you have any questions please contact Megunolink. And if you made it this far – check out my new book “Arduino Workshop” from No Starch Press.
In the meanwhile have fun and keep checking into tronixstuff.com. Why not follow things on twitter, Google+, subscribe for email updates or RSS using the links on the right-hand column? And join our friendly Google Group – dedicated to the projects and related items on this website. Sign up – it’s free, helpful to each other – and we can all learn something.
[Note - Megunolink Pro software license was a promotional consideration]
Planet Arduino is, or at the moment is wishing to become, an aggregation of public weblogs from around the world written by people who develop, play, think on Arduino platform and his son. The opinions expressed in those weblogs and hence this aggregation are those of the original authors. Entries on this page are owned by their authors. We do not edit, endorse or vouch for the contents of individual posts. For more information about Arduino please visit www.arduino.cc
You are currently browsing the archives for the data category.