Posts | Comments

Planet Arduino

Archive for the ‘data’ Category

Jul
12

Paper ROM

arduino hacks, data, reflectance, rom Comments Off on Paper ROM 

paper_rom2

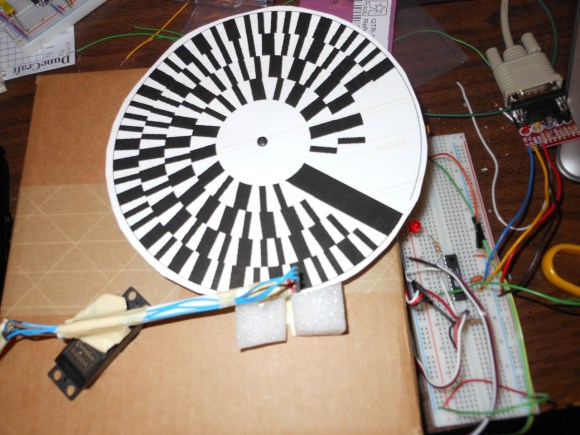
This low-resolution memory device packs in just a few bytes of data. But it’s enough to spell out [Michael Kohn's] name. He’s been experimenting with using paper discs for data storage.

His technique becomes immediately clear when you view the demo video below. The disc spins multiple times with the sensor arm reading one track. This gives the system the chance to measure the black band in order to get the data timing figured out. Once the outer track has been read the servo controlling the read head swings it to the next until all of the data is captured.

An Arduino is monitoring the QTR-1RC reflectance sensor which makes up the reading head. It uses the black band width in order to establish the size of an individual byte. Interestingly enough, the white parts of the disc do not contain data. Digital 0 is a black area 1/4 the width of the large black strip, and digital 1 is half as wide.

[Michael's] set up the generator which makes the discs so that he can easily increase the resolution. The limiting factor is what the reading hardware is able to detect.


Filed under: Arduino Hacks
Feb
22

People Watching with “Social Observer” Natalia Buckley

arduino, data, Electronics, Maker Faire, Makers Comments Off on People Watching with “Social Observer” Natalia Buckley 

Natalia BuckleyNatalia Buckley is a hacker, designer, and creative technologist. She's originally from Poland and now live in Brighton on England's south coast, a city famed for its appetite for experimentation. "I'm just making speculative things, that don't necessarily fully exist in the real world, but help us learn something," she says. "I'm a social observer. The sole reason I make things is to learn something about other people. Because I find other people fascinating. My work in technology is basically about people. People constantly interact with technology and I can make technology to watch them do stuff!"

Read the full article on MAKE

Jun
27

Improving Arduino to PC Interactions with MegunoLink

arduino, capture, connection, data, interaction, logging, megunolink, serial, software review Comments Off on Improving Arduino to PC Interactions with MegunoLink 

Introduction

Through a colleague I was introduced to a new piece of software for the Windows environment which comprises of useful tools that interact with an Arduino-style board (or other MCU with serial data). The software is called MegunoLink, from BlueLeafSoftware in New Zealand. Megunolink has many useful features, and we’ll run through them briefly in this article. They include:

  • Serial port monitoring – that doesn’t reset the MCU
  • The ability to capture serial port data to a text file
  • A tool to graph formatted data sent from the Arduino in real time
  • “George” the serial monkey! (see below)
  • Enable building Arduino projects using ATMEL AVRstudio
  • And Megunolink can also act as a graphical interface for AVRdude to upload compiled code to an Arduino

Installation was simple and straightforward. The installation is only ~1.5 megabytes and not taxing at all. We only have a Windows 7 64-bit machine, so haven’t tested this in emulation under MacOS or Linux. Before moving ahead, note that the software is free. However the developers do ask for a US$10 donation, and if you use the software more than once this is a very fair amount to pay for such a featured piece of software. Now for a look at each of the features.

Serial Data monitoring

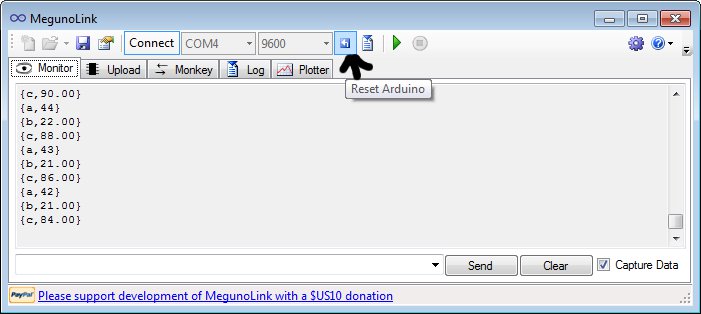
As with the Serial Monitor in the Arduino IDE, you can monitor the data from the Arduino, and also send it back through the serial line. Just click the ‘Monitor’ tab and you’re set, for example:

However unlike the Arduino IDE, opening the monitor does not reset the Arduino. But if you do need to perform a reset, a button on the toolbar is provided as shown below:

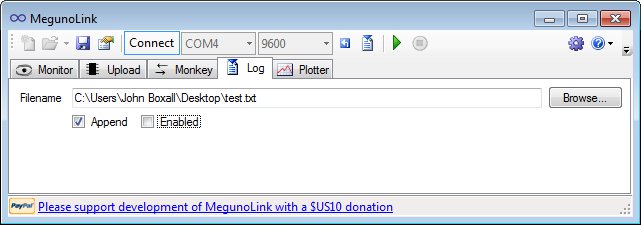
Capturing Serial Data to a file

Very useful indeed, much quicker than dumping data to a microSD card and then bringing it back to the PC. Just click the ‘Log’ tab, specify a file location and name, then click ‘Enabled’, for example:

You can also append data to an existing text file. When creating the output format in your Arduino sketch, be mindful to have separators such as commas or colons – which make it much easier to delimit the data once imported into a spreadsheet or database application.

Plotting and Graphing Serial Data

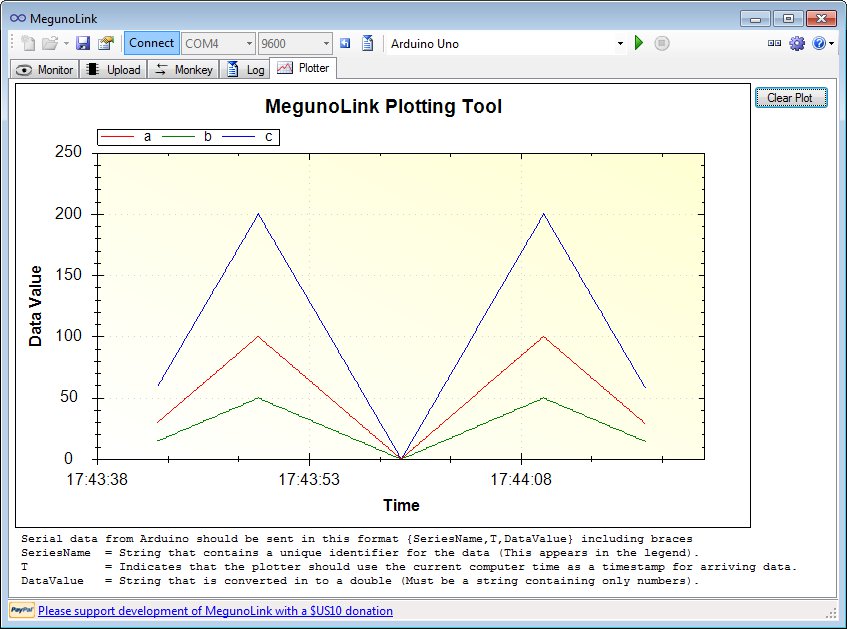
Plotting data to a graph is very simple. You simply format the data you’d like to plot using Serial.write commands, and Megunolink takes care of the rest – just click the ‘Plotter’ tab and you’re off.  The data must be formatted as such:

{a, T, b}

Where ‘a’ is the name of the series. T tells MegunoLink to plot the actual real time, and b is the data as a number in string form. Here is a very simple example:

void setup()
{
 Serial.begin(9600);
}
int a=0;
float b,c;
void loop()
{
 for (int a=0; a<100; a++)
 {
 b=a/2;
 c=a*2;
 Serial.print("{a,T,"); 
 Serial.print(a);
 Serial.println("}");
 Serial.print("{b,T,");
 Serial.print(b);
 Serial.println("}"); 
 Serial.print("{c,T,");
 Serial.print(c);
 Serial.println("}"); 
 delay(100);
 }
 for (int a=100; a>0; --a)
 {
 b=a/2;
 c=a*2;
 Serial.print("{a,T,"); 
 Serial.print(a);
 Serial.println("}");
 Serial.print("{b,T,");
 Serial.print(b);
 Serial.println("}"); 
 Serial.print("{c,T,");
 Serial.print(c);
 Serial.println("}"); 
 delay(100);
 }
}

which resulted with:

Here is another example, it is the “SendSineCurve” sketch from the Arduino Graphing library:

You can always save the graph as an image in the usual formats as well as in .emf vector image file format.

“George” the Serial Monkey

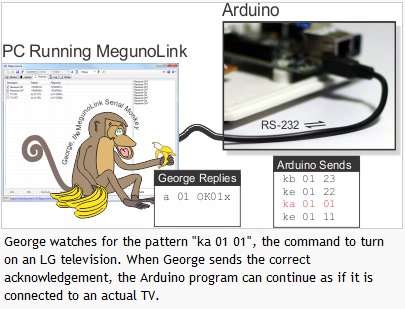
This is a serial protocol simulator tool which is useful for testing the control of serial-based devices. You can setup George so that it listens for a particular pattern in the serial output from an Arduino – and then sends back a response of your choice to the Arduino. For example:

For a more detail explanation and detail tutorial on how to control George, see the MegunoLink website.

Arduino Development with AVR Studio 

Using MegunoLink you can develop Arduino projects with Atmel AVRStudio software. As some people find the Arduino IDE somewhat limiting, this option gives you access to the more programmer-friendly Atmel IDE, for example:

Although there is a small amount of tasks to make this possible, it is straightforward to do so, and an easy to follow tutorial has been provided at the MegunoLink website.

Upload compiled .HEX files to Arduino

For those using avrdude to upload compiled .hex files to an Ardiuno, you can also do this using the GUI MegunoLink interface. This is also used for uploading the compiled files generated in AVRStudio, for example:

As with all the other MegunoLink features – there is a relevant tutorial available on the website.

Conclusion

MegunoLink works well, is easy to use, and the price is right. It has to be the simplest tool available for plotting data from a microcontroller, or capturing it to a file without any extra hardware. So download it and give it a try, it won’t cost you anything and I’m sure you will find a use for it in the near future. And remember – if you’re using MegunoLink, please consider making a donation towards the development of further versions. Thanks to Freetronics for the use of their top-notch Arduino-compatible hardware.

In the meanwhile have fun and keep checking into tronixstuff.com. Why not follow things on twitterGoogle+, subscribe  for email updates or RSS using the links on the right-hand column? And join our friendly Google Group – dedicated to the projects and related items on this website. Sign up – it’s free, helpful to each other –  and we can all learn something.


Jun
27

Introduction

Through a colleague I was introduced to a new piece of software for the Windows environment which comprises of useful tools that interact with an Arduino-style board (or other MCU with serial data). The software is called MegunoLink, from BlueLeafSoftware in New Zealand. Megunolink has many useful features, and we’ll run through them briefly in this article. They include:

  • Serial port monitoring – that doesn’t reset the MCU
  • The ability to capture serial port data to a text file
  • A tool to graph formatted data sent from the Arduino in real time
  • “George” the serial monkey! (see below)
  • Enable building Arduino projects using ATMEL AVRstudio
  • And Megunolink can also act as a graphical interface for AVRdude to upload compiled code to an Arduino

Installation was simple and straightforward. The installation is only ~1.5 megabytes and not taxing at all. We only have a Windows 7 64-bit machine, so haven’t tested this in emulation under MacOS or Linux. Before moving ahead, note that the software is free. However the developers do ask for a US$10 donation, and if you use the software more than once this is a very fair amount to pay for such a featured piece of software. Now for a look at each of the features.

Serial Data monitoring

As with the Serial Monitor in the Arduino IDE, you can monitor the data from the Arduino, and also send it back through the serial line. Just click the ‘Monitor’ tab and you’re set, for example:

However unlike the Arduino IDE, opening the monitor does not reset the Arduino. But if you do need to perform a reset, a button on the toolbar is provided as shown below:

Capturing Serial Data to a file

Very useful indeed, much quicker than dumping data to a microSD card and then bringing it back to the PC. Just click the ‘Log’ tab, specify a file location and name, then click ‘Enabled’, for example:

You can also append data to an existing text file. When creating the output format in your Arduino sketch, be mindful to have separators such as commas or colons – which make it much easier to delimit the data once imported into a spreadsheet or database application.

Plotting and Graphing Serial Data

Plotting data to a graph is very simple. You simply format the data you’d like to plot using Serial.write commands, and Megunolink takes care of the rest – just click the ‘Plotter’ tab and you’re off.  The data must be formatted as such:

Where ‘a’ is the name of the series. T tells MegunoLink to plot the actual real time, and b is the data as a number in string form. Here is a very simple example:

which resulted with:

Here is another example, it is the “SendSineCurve” sketch from the Arduino Graphing library:

You can always save the graph as an image in the usual formats as well as in .emf vector image file format.

“George” the Serial Monkey

This is a serial protocol simulator tool which is useful for testing the control of serial-based devices. You can setup George so that it listens for a particular pattern in the serial output from an Arduino – and then sends back a response of your choice to the Arduino. For example:

For a more detail explanation and detail tutorial on how to control George, see the MegunoLink website.

Arduino Development with AVR Studio 

Using MegunoLink you can develop Arduino projects with Atmel AVRStudio software. As some people find the Arduino IDE somewhat limiting, this option gives you access to the more programmer-friendly Atmel IDE, for example:

Although there is a small amount of tasks to make this possible, it is straightforward to do so, and an easy to follow tutorial has been provided at the MegunoLink website.

Upload compiled .HEX files to Arduino

For those using avrdude to upload compiled .hex files to an Ardiuno, you can also do this using the GUI MegunoLink interface. This is also used for uploading the compiled files generated in AVRStudio, for example:

As with all the other MegunoLink features – there is a relevant tutorial available on the website.

Conclusion

MegunoLink works well, is easy to use, and the price is right. It has to be the simplest tool available for plotting data from a microcontroller, or capturing it to a file without any extra hardware. So download it and give it a try, it won’t cost you anything and I’m sure you will find a use for it in the near future. And remember – if you’re using MegunoLink, please consider making a donation towards the development of further versions. Thanks to Freetronics for the use of their top-notch Arduino-compatible hardware.

In the meanwhile have fun and keep checking into tronixstuff.com. Why not follow things on twitterGoogle+, subscribe  for email updates or RSS using the links on the right-hand column? And join our friendly Google Group – dedicated to the projects and related items on this website. Sign up – it’s free, helpful to each other –  and we can all learn something.

The post Improving Arduino to PC Interactions with MegunoLink appeared first on tronixstuff.

May
29

In this review we examine the new Agilent U1177A infra-red to Bluetooth adaptor for the Agilent  U1272A DMM. You can also use the adaptor with the U1240-series DMMs with the optional adaptor. With some PC or Android device software you can monitor or log data from up to three DMMs. So let’s have a look and see what it’s all about.

Introduction

The adaptor arrives in a small box:

… with the following contents:

It was a relief to see the AAA cells included as we didn’t have any in stock. The yellow document is the China RoHS sheet, and the instructions are short but well detailed. The unit itself is quite small:

To fit the battery or reset the device, the front cover slides open revealing the innards to some degree:

and the rear:

The unit clips soundly to the rear of the DMM, however it does stick out quite a lot:

If you need to leave the meter unattended, you’ll need a level and vibration free surface, as the adaptor can be knocked out relatively easily from the top. The adaptor also blocks the hole at the back which some users may use with a hook or loop for positioning the DMM.

Software and Operation

You can use the U1177 with two platforms – Android and Windows, and we tested both. I’m sure if you have Mac Parallels, etc., that there may be some success there but I haven’t tested them. There are two applications available for Android devices – the mobile logger and mobile meter. You can download them both from the Google Play app – just search for ‘agilent‘, and the results should be

The third app is a game that is somewhat entertaining. We tried the applications on two Android devices – a HTC Velocity running Android 4.0.3 (which failed miserably, the software kept freezing) and a Motorola Xoom MZ601 with Android 3.2. I would say now that the software is marked “Beta” so caveat emptor. The data logging software worked on the Xoom but not the “Agilent Mobile Meter”. Moving forward, the logging software is quite good – you can display a graph, table or statistical value of the incoming data from up to three separate DMMs.

Below is a rough video of using the Xoom with data logging. We first make the Bluetooth connection, then measure resistance of a 1k ohm logarithmic pot, change the view to data table, then stop the logging and email the data. The app can email a .csv file which can be opened with any spreadsheet, etc. Using the app you can label each DMM feed to avoid confusion with the data files in the future.

Using the U1177A with a Windows 7 x64 machine was a lot more successful. You can download the Windows-based software from here (97 MB). After pairing the adaptor with the bluetooth connection software, the Agilent software loads but does not connect. You need to alter the data speed to 19200bps and select the COM port from the drop-down list in the “communication settings” on the left-hand side of the window, as shown below:

You can also use terminal software and AT commands to change the parameters of the U1177A, which is described in the user manual. Moving forward, once connected you can measure and log to your heart’s content. You can display a virtual meter:

Or choose a graphing display mode:

Note the short drop in value to zero as the graph increased on the far-right of the measurement in the image above. This occurs when the meter is changing range, just as the LCD will blink off then on due to the same phenomenon. Finally, you can also display the data as a table, for example:

Finally, you can export the data to a .csv file which can be opened with the usual spreadsheet or text editing software:

Using Windows OS Remote Multimeter Use Data Logging Other connection – hyperterminal etc. 

Conclusion

For data logging to a PC that is in Bluetooth range, the U1177A fits the bill. Although you can get a serial to IR cable (and early U1272A owners should have received one when the firmware update was released), the Bluetooth module will certainly be useful when moving around a worksite, or taking remote measurements from extreme temperature or NVH environments. The Android apps need to move out of beta stage – however due to the variety of devices and OS versions in the market this may be a long journey. However considering the price (~Au$52) it is inexpensive enough to keep around just-in-case.

Note – the U1177A was purchased by myself and reviewed without notice. Residing in Australia, ours was purchased from element14.com.

In the meanwhile have fun and keep checking into tronixstuff.com. Why not follow things on twitterGoogle+, subscribe  for email updates or RSS using the links on the right-hand column? And join our friendly Google Group – dedicated to the projects and related items on this website. Sign up – it’s free, helpful to each other –  and we can all learn something.
The post Review: Agilent U1177A IR to Bluetooth Adaptor appeared first on tronixstuff.


  • Newsletter

    Sign up for the PlanetArduino Newsletter, which delivers the most popular articles via e-mail to your inbox every week. Just fill in the information below and submit.

  • Like Us on Facebook