Posts | Comments

Planet Arduino

Archive for the ‘api’ Category

Arduino Cloud Free

There are dozens, if not hundreds of amazing Arduino Cloud features. So it’s perfectly understandable if you’ve missed some of them.

So we’ve put together a list of our favorite Arduino Cloud features that you might not know existed.

1) Auto-generate Sketches

We’ve talked elsewhere about getting an understanding of what cloud computing really is, and how it’s not just the domain of experts. The cloud is how total beginners can get started much more easily. There’s no better demonstration of that than our first top Arduino Cloud feature; auto-generated sketches.

When you create a new “Thing” in your Arduino Cloud, you add various bits of info to it. Wi-Fi connection credentials, and any variables you want to control or monitor. The Cloud automatically generates a starting sketch from this info. That sketch can then be sent to your boards, so all your initial configuration is taken care of, without a single line of code.


2) Device-to-Device Communication

There’s simply no easier way to make two microcontroller boards talk to each other than Arduino Cloud. We’ve covered in detail how easy it is to wirelessly connect your boards.

This isn’t just for Arduino devices either. If you want any combination of Arduino, ESP32 and ESP8266 devices to work together, this is how you do it.


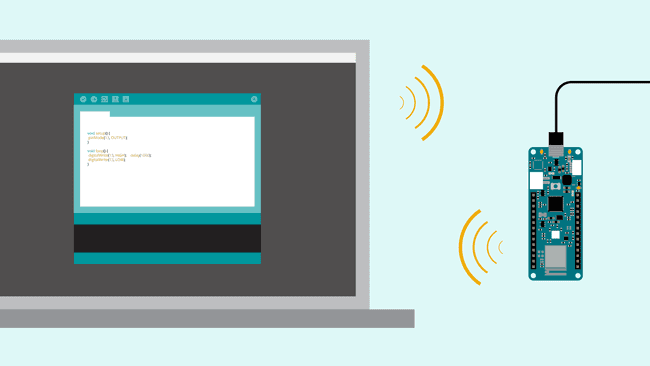
3) Over-the-Air Updates

Working through your Arduino Cloud means you don’t have to disconnect any Arduino boards when updating them. If you want to edit or add a new sketch, it can all be done wirelessly, over-the-air.

Anyone who’s had to dismantle a project or device to get to a board’s USB socket will appreciate the simple, vital value of this feature. It’s one of those things that you’ll wonder how you ever lived without.

Arduino cloud features over-the-air updates

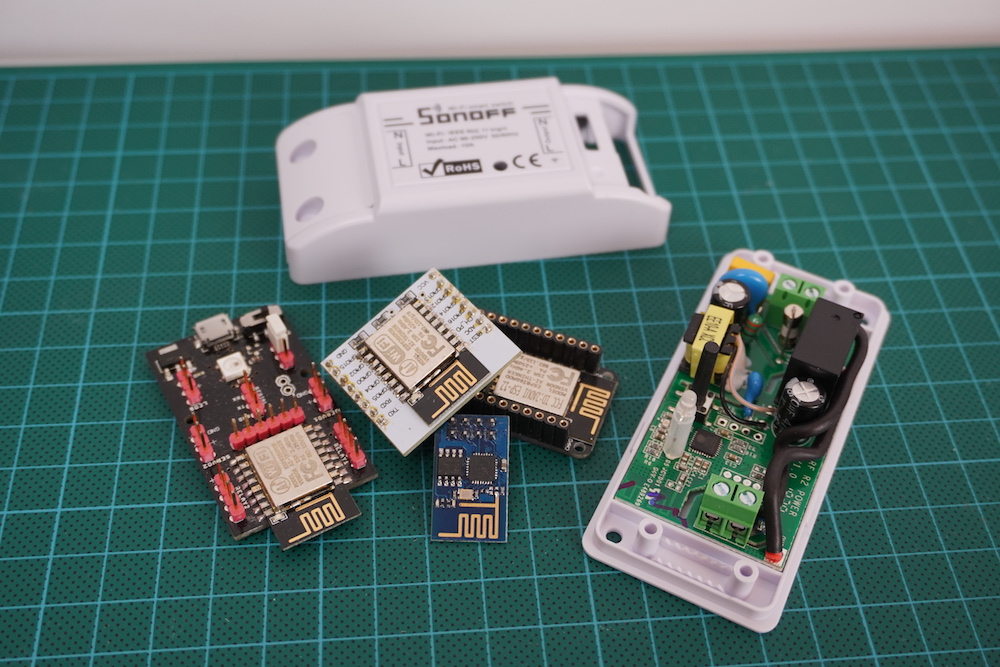
4) Support for ESP Boards

There’s a reason we call it the Arduino IoT Cloud. This is an all-encompassing platform for Internet of things, home automation, and electronics project control and management. So first we added support for ESP8266 devices. More recently, experimental support for ESP32 boards became available.

So even if your project doesn’t actually have any Arduino products in there, the Cloud is just as useful. Secure, private, and accessible to all kinds of IoT and maker devices.

Arduino Cloud also supports ESP8266 and ESP32

5) Trigger Actions on Cloud Events

Arduino Cloud makes it super easy to do things that you might normally need the IDE for. But it’s also got lots of exclusive features that you only get in the Cloud.

For example, there are actions that can be triggered based on your board’s interactions with your Arduino Cloud. You can include actions within your sketches when a Cloud connection is successful, and when the Cloud has synced with a device. Or perhaps most useful of all, trigger an action if Cloud connectivity is lost. Getting an indication that a project has disconnected could be incredibly useful!

Here’s an example of using these actions within a sketch.


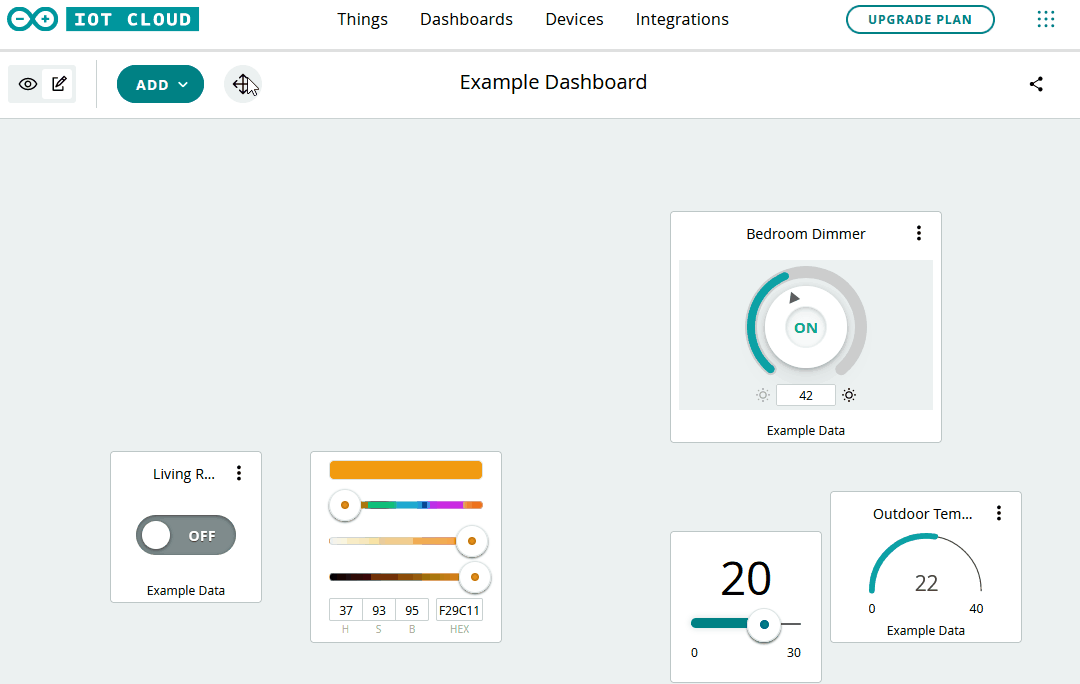
6) Sharing Your Dashboards

Dashboards are control panels within your Arduino Cloud. It’s one of the most powerful Arduino Cloud features, and essential to making full use of Cloud control. But what’s often overlooked is that you can share dashboards with anyone you want.

For example, let’s say you’re using Arduino Cloud to control your home automation. You can set up a dashboard for a tablet in the living room that the whole family can use, but doesn’t have sensitive admin controls in there. And then another for people to use on their phones. 

All Cloud plans include unlimited dashboards. And anyone can have a free Cloud account. So you can create as many dashboards as you like, and share them with literally anyone, anywhere.

Share dashboards with anyone you want from Arduino Cloud

7) Alexa Integration

Natural language voice control is genuine Star Trek stuff. So it’s no wonder people love the functionality of Alexa. Did you know it’s incredibly easy to connect your Arduino Cloud to Alexa? And once you have, it effectively adds voice control to every board, and every project. Nothing else needed.

There’s literally no easier way to make an Alexa-controlled device or project than with your Arduino Cloud. You’ll never look back, and you’ll always have someone to talk to.


8) Full API Integration

For the engineers, coders, developers and those among you who’ve been using Arduino for a long time, API integration is the powerhouse secret feature you’ve been looking for.

The API can be called with any HTTP client, or with languages like Javascript, Python, Golang and more. It’s what you need to incorporate the power of Arduino Cloud features into your systems, platforms and projects.


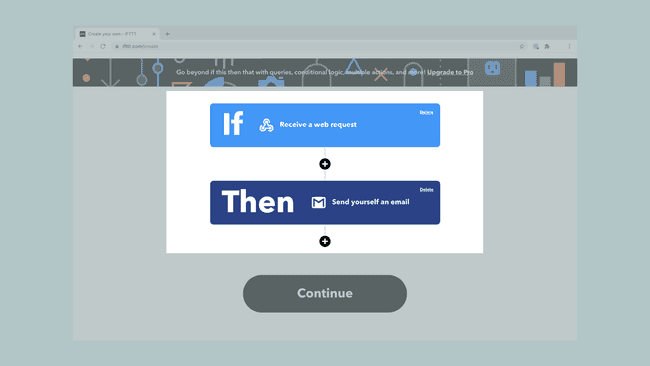
9) Use IFTT, Zapier and More with Webhooks

There are lots of reasons you might want to include control platforms outside of your Arduino Cloud. Like sending an email or a Tweet when you press a button on a Nano, or a device disconnects from the Cloud (see above).

That’s what webhooks are for, and they give you a universal way to send commands out of Arduino Cloud, and into… well, anything!

IFTTT and Zapier are great examples of services that can do almost anything from a webhook. Get to know this feature, and connected projects suddenly have easy access to the whole web.


10) Easy Firmware Updates

When you connect a new Arduino board, your Arduino Cloud automatically checks its firmware version. If there’s an update available, it offers you the option of applying that update.

Very easy, and you don’t have to worry about finding the correct/latest firmware version yourself. This simple, background function makes sure your boards and projects always have the latest features, security updates and bug fixes.

For people who use a lot of Arduino devices, it’s worth adding them to the Cloud for this feature alone.


11) Full Dashboard Customization

We’ve already talked about unlimited dashboards in your Arduino Cloud. Creating them is easy, but did you know you can customize them too?

Anyone who’s dipped their toe in the home automation waters knows how essential dashboard editing is. Some platforms work great, but offer very little when it comes to controlling your dashboard layout. For many people, that’s a deal breaker.

Your Arduino Cloud widgets can easily be added, edited, removed, repositioned and resized in any configuration you want. It’s as simple as drawing and resizing boxes, but the result makes your Cloud projects infinitely more useable.


12) Watchdog Timer

The Arduino Cloud automatically runs a watchdog timer that will reset your board, hardware or project if it crashes. This is a small feature, but a powerful one that can keep your projects running while unattended. 

It means you never have to manually reset it when you eventually realize it’s not been running all day. You can have devices running remotely (very remotely, with SIM or LoRa connectivity) and be sure they’re robust enough to keep on ticking.

It’s included and running automatically, but can easily be disabled if you don’t need it.


13) Node-RED Integration

Arduino provides a super easy way to use Node-RED for IoT automations. This is a powerful, but very easy-to-use visual programming platform specifically designed for IoT projects.

Complex automations using advanced triggers like sunrise or sunset, presence detection, combined actions or sensor readings and so much more. The possibilities are endless, and learning Node-Red is incredibly easy. Get to grips with this feature, and you’ll be creating IoT automations that would otherwise need an experienced coder.


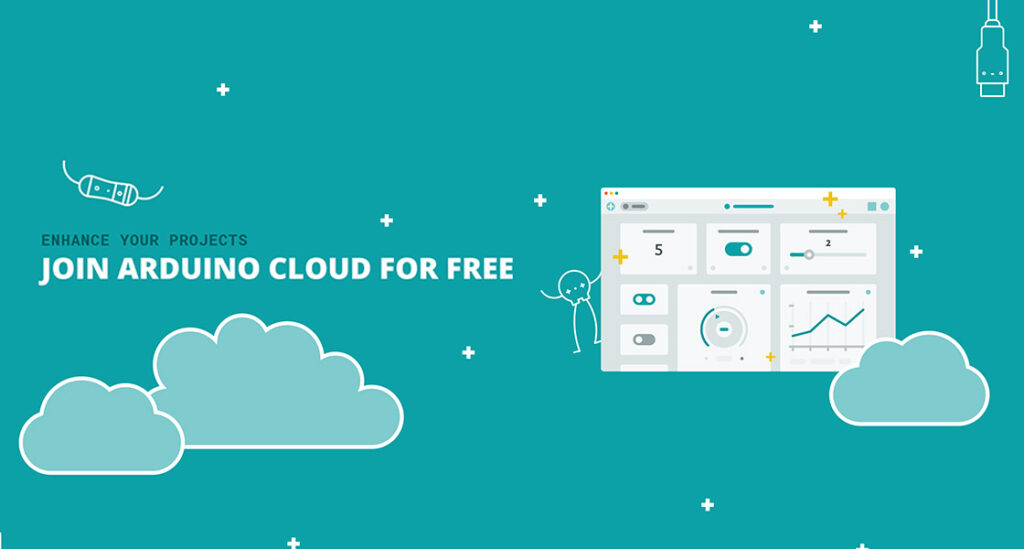
13A) Fully Functional Free Account

One of the best kept secrets of the Arduino Cloud is that if you’re registered on the Arduino website or forum, you already have a free Cloud waiting for you. Simply head on over to the Cloud site and get started with unlimited dashboards and unlimited sketches. The free tier of Arduino Cloud is fully functional, and it’s ready and waiting for you to give it a try.

In fact, it’s the perfect option especially if you haven’t used Arduino before! Give it a shot and let us know what you think. No credit card required; just your creativity and a passion for connected projects.

The post 14 Awesome Arduino Cloud Features You Never Knew Existed appeared first on Arduino Blog.

For most of us, getting weather information is as trivial as unlocking a smartphone or turning on a computer and pointing an app or browser at one’s weather site of choice. This is all well and good, but it lacks a certain panache that old weather stations had with their analog dials and stained wood cases. The weather station that [BuildComics] created marries both this antique aesthetic with modern weather data availability, and then dials it up a notch for this enormous analog weather station build.

The weather station uses 16 discrete dials, each modified with a different label for the specific type of data displayed. Some of them needed new glass, and others also needed coils to be modified to be driven with a lower current than they were designed as well, since each would be driven by one of two Arduinos in this project. Each are tied to a microcontroller output via a potentiometer which controls the needle’s position for the wildly different designs of meter. The microcontrollers themselves get weather information via the internet, which allows for about as up-to-date information about the weather as one could gather first-hand.

The amount of customization of these old meters is impressive, and what’s even more impressive is the project’s final weight. [BuildComics] reports that it took two people just to lift it onto the wall mount, which is not surprising given the amount of iron in some of these old analog meters. And, although not as common in the real world anymore, these old antique meters have plenty of repurposed uses beyond weather stations as well.

ocat

Over the last couple of years, cat videos have become the undisputed champions of the web. Whether it’s kittens playing with their shadows to failed jump attempts to giving each another massages, we’re all guilty of watching a few of these clips from time to time (yes, even at work). Built with this in mind, oCat is a real-time tracker for feline-related activity on the Internet.

oCat consists of two parts: the oCat News Distractor and the Kitty o’Cat Twitter bot. Using Google’s YouTube API, the system works by continuously monitoring for new uploads, the number of new views each day, or a specific video that has received a remarkable amount of attention. It then tweets these stats and prints them out on thermal paper, stamping a paw print on the timeline for every 1,000 views.

Created by Annika Engelhardt, a digital media design master’s student at the University of the Arts in Bremen, oCat uses an Arduino along with an ESP Wi-Fi module, a servo, and an LCD screen. The aim of the project is to increase and reveal the amount of hours people spend watching cat videos online.

The cat is an altered Maneki-neko, holding a stamp using welding wire and hot glue. Even though I filled the stamp with extra ink, it did not work properly and I had to cut out the paw-shape from a sponge and glue it onto the original stamp.

The thermal printer used in the device needs a USB connection, so I used a Raspberry Pi to control it. I wrote a Python script that checks four different RSS news feeds for new posts every 15 minutes and prints one headline with a timestamp every minute.

The Twitter bot was programmed using Python and a library called tweepy. Most of the script is reading JSON files, juggling and comparing data and text files and in the end mixing up parts of a sentence to form a tweet. The bot will be enhanced in the future

fd014c44519451.5814af0a88949

Engelhardt exhibited the project at Galerie Flut in Bremen back in October. You can find more pictures and information on the project here.

timely

A group of students (Kate Twomey, Leila ByronDaan Weijers, Luuk Rombouts) at the Copenhagen Institute of Interaction Design explored the creation of a tangible user interface displaying personal calendar’s meetings without using a screen.
The installation is called Timely and uses Temboo, Google Calendar API and a Genuino MKR1000 to pull all the upcoming week’s events and displaying each of them with a rotation of a laser cut base and its red strings:

The visual forecast is used to create awareness, while capacitive sensors in timely make it easy to adjust busy days by simply grabbing all three prongs of the chosen day. timely will then distribute your time more evenly throughout the day by rescheduling events and meetings, while automatically notifying attendees if needed.

IMG_7356-1024x683

Feb
05

Display Your City’s Emotional State with Illuminated Snow

alchemy, api, arduino, arduino hacks, christmas, ethernet, Holiday Hacks, holliday, LED, leds, lights, mood, sentiment, strip, twitter Comments Off on Display Your City’s Emotional State with Illuminated Snow 

[Hunter] wanted to do something a bit more interesting for his holiday lights display last year. Rather than just animated lights, he wanted something that was driven by data. In this case, his display was based on the mood of people in his city. We’ve seen a very similar project in the past, but this one has a few notable differences.

The display runs off of an Arduino. [Hunter] is using an Ethernet shield to connect the Arduino to the Internet. It then monitors all of the latest tweets from users within a 15 mile radius of his area. The tweets are then forwarded to the Alchemy Sentiment API for analysis. The API uses various algorithms and detection methods to identify the overall sentiment within a body of text. [Hunter] is using it to determine the general mood indicated by the text of a given tweet.

Next [Hunter] needed a way to somehow display this information. He opted to use an LED strip. Since the range of sentiments is rather small, [Hunter] didn’t want to display the overall average sentiment. This value doesn’t change much over short periods of time, so it’s not very interesting to see. Instead, he plots the change made since the last sample. This results in a more obvious change to the LED display.

Another interesting thing to note about this project is that [Hunter] is using the snow in his yard to diffuse the light from the LEDs. He’s actually buried the strip under a layer of snow. This has the result of hiding the electronics, but blurring the light enough so you can’t see the individual LEDs. The effect is rather nice, and it’s something different to add to your holiday lights display. Be sure to check out the video below for a demonstration.


Filed under: Arduino Hacks, Holiday Hacks
Dec
24

Here’s something that will probably make it to a wall right next to the people responsible for the Hackaday servers sometime soon, and should be something every web dev should build at some point: a website response meter, an analog gauge that will tell you how long it takes to reach your website.

The build is simple enough, with a micro servo working as a gigantic analog gauge. There are also a pair of four-digit, seven-segment displays for displaying a digital number and the number of website requests per second. There’s also an 8×8 matrix of bi-color LEDs for showing a green happy face or a red frowny face, just in case all that data wasn’t self-evident to the uninitiated.

All the electronics are handled by an Arduino, but what really makes this build useful, or even possible, is the bit of code that runs on a computer. The computer uses an API from New Relic, a software analytics company, to come up with the response time and requests per second. That data is pulled down and piped up to the Arduino that displays everything on a beautifully milled acrylic sheet.


Filed under: Arduino Hacks

Introduction

It’s 2014 and the Internet-of-Things is flying along at a rapid rate with all sorts of services and devices that share data and allow control via the Internet. In the spirit of this we look a new service called plotly.

This is a “collaborative data analysis and graphing tool” which allows you to upload your own data to be analysed in many ways, and then graph the results using all sorts of plot types.

With plotly you can run your own mathematical functions over your data, run intense statistical analysis and use or edit one of the many APIs (PythonMATLABRJuliaRESTArduino, or Perl) to increase the level of customisation. Plotly works in conjunction with Google Drive to store your data, however this can be exported and imported without any issues. Futhermore plotly works best in Google Chrome.

For our review we’ll look at using plotly to quickly display and analyse data received from an Internet-connected Arduino – our EtherTen, or you can use almost any Arduino and Ethernet shield. The system isn’t completely documented however by revieiwng our example sketch and some experimenting with the interface plotly is very much usable, even in its current beta format.

Getting started with plotly

You will need to setup a plotly account, and this is simply accomplished from their main site. Some of you may be wondering what plotly costs – at the time of writing plotly is free for unlimited public use (that is – anyone can see your data with the right URL), but requires a subscription for extended private use. You can find the costs at the plans page.

Once you have a plotly account, visit your plotly home page, whose URL is https://plot.ly/~yourusername/# – then click “edit profile”. Another window will appear which amongst other things contains your plotly API key – make a note of this as you will need it and your username for the Arduino sketch.

Next, you’ll need some Arduino or compatible hardware to capture the data to log and analyse. An Arduino with an Ethernet or WiFi connection, and appropriate sensors for your application. We have our EtherTen that takes readings from a temperature/humidity sensor and a light level sensor:

Freetronics EtherTen Arduino Plotly

Now you need a new Arduino library, which is available from the plotly API page. Lots of APIs there… Anyhow, click “Arduino” and you will arrive at the github page. Download the entire .zip file, and extract the plotly_ethernet folder into Arduino libraries folder which in most installations can be found at ..Arduino-1.0.xlibraries. 

plotly arduino library folder

Finally we’ll use a demonstration sketch provided by plotly and modify this to our needs, which can be downloaded from github. We’ll go through this sketch and show you what to update – so have a quick look and then at out example sketch at the end of this section.

First, insert any code required to get data from your sensors and store the data in a variable – do this so the values can be used in void loop. Next, update the MAC address and the IP address of your Ethernet-enabled Arduino with the following lines:

byte mac[] = { 0xDE, 0xAD, 0xBE, 0xEF, 0xFE, 0xED };
byte my_ip[] = { 192,168,0,77 };

and change the MAC and IP if necessary. If Arduino and Ethernet is new to you, check out the tutorial. Now look for the following two lines and enter your plotly username and API key:

plotly.username = "yourplotlyusername";
plotly.api_key = "yourplotlyAPIkey";

Next – it’s a good idea to set your time zone, so the time in plots makes sense. Add the following two lines in void setup():

plotly.timestamp = true; 
plotly.timezone = "Australia/Melbourne";

You can find a list of time zones available for use with plotly here. Now you need to determine how many traces and points to use. A trace is one source of data, for example temperature. For now you will have one point, so set these parameters using the following lines:

int nTraces=x; // x = number of traces
int nPoints=1;

For example, we will plot temperature, humidity and light level – so this requires three traces. The next step is to set the filename for the plot, using the following line:

char filename[] = "simple_example";

This will be sent to plotly and your data will be saved under that name. At the point in your sketch where you want to send some data back to plotly, use:

plotly.open_stream(nPoints, nTraces, filename, layout);

… then the following for each trace:

plotly.post(millis(),data);

where data is the variable to send back to plotly. We use millis() as our example is logging data against time.

To put all that together, consider our example sketch with the hardware mentioned earlier:

// Code modified from example provied by plot.ly

#include <SPI.h>
#include <Ethernet.h>
#include "plotly_ethernet.h"
#include "DHT.h"

// DHT Sensor Setup
#define DHTPIN 2               // We have connected the DHT to Digital Pin 2
#define DHTTYPE DHT22          // This is the type of DHT Sensor (Change it to DHT11 if you're using that model)
DHT dht(DHTPIN, DHTTYPE);      // Initialize DHT object
plotly plotly;                 // initialize a plotly object, named plotly

//initialize plotly global variables
char layout[]="{}";
char filename[] = "Office Weather and Light"; // name of the plot that will be saved in your plotly account -- resaving to the same filename will simply extend the existing traces with new data

float h, t, ll;
int lightLevel;

// Ethernet Setup
byte mac[] = { 0xDE, 0xAD, 0xBE, 0xEF, 0xFE, 0xED }; // doesn't really matter
byte my_ip[] = { 192, 168, 1, 77 }; // google will tell you: "public ip address"

void startEthernet(){
  Serial.println("Initializing ethernet");
  if(Ethernet.begin(mac) == 0){
    Serial.println("Failed to configure Ethernet using DHCP");
    // no point in carrying on, so do nothing forevermore:
    // try to congifure using IP address instead of DHCP:
    Ethernet.begin(mac, my_ip);
  }
  Serial.println("Done initializing ethernet");
  delay(1000);
}

void setup() {
  // Open serial communications and wait for port to open:
  Serial.begin(9600);
  while (!Serial) {
    ; // wait for serial port to connect. Needed for Leonardo only
  }

  dht.begin(); // initialize dht sensor reading
  startEthernet();    // initialize ethernet

    // Initialize plotly settings
  plotly.VERBOSE = true; // turn to false to suppress printing over serial
  plotly.DRY_RUN = false; // turn to false when you want to connect to plotly's servers 
  plotly.username = "yourplotlyusername"; // your plotly username -- sign up at https://plot.ly/ssu or feel free to use this public account. password of the account is "password"
  plotly.api_key = "yourplotlyapikey"; // "public_arduino"'s api_key -- char api_key[10]
  plotly.timestamp = true; // tell plotly that you're stamping your data with a millisecond counter and that you want plotly to convert it into a date-formatted graph
  plotly.timezone = "Australia/Melbourne"; // full list of timezones is here:https://github.com/plotly/arduino-api/blob/master/Accepted%20Timezone%20Strings.txt
}

void loop() 
{
  // gather data to plot
  h = dht.readHumidity(); // read humitidy from DHT pin
  t = dht.readTemperature();
  lightLevel = analogRead(A5);
  ll = lightLevel / 100; // reduce the value from the light sensor

  // Open the Stream
  plotly.open_stream(1, 3, filename, layout); // plotlystream(number_of_points, number_of_traces, filename, layout)

  plotly.post(millis(),t); // post temperature to plotly (trace 1)
  delay(150);
  plotly.post(millis(),h); // post humidity to plotly (trace 2)
  delay(150);
  plotly.post(millis(),lightLevel); // post light sensor readout to plotly (trace 3)

  for(int i=0; i<300; i++)
  { // (once every five minutes)
    delay(1000);
  }
}

After wiring up the hardware and uploading the sketch, the data will be sent until the power is removed from the Arduino.

Monitoring sensor data

Now that your hardware is sending the data off to plotly, you can check it out in real time. Log into plotly and visit the data home page – https://plot.ly/plot – for example:

plotly home data page

Your data file will be listed – so just click on the file name to be presented with a very basic graph. Over time you will see it develop as the data is received, however you may want to alter the display, headings, labels and so on. Generally you can click on trace labels, titles and so on to change them, the interface is pretty intuitive after a few moments. A quick screencast of this is shown in this video.

To view and analyse the raw data – and create all sorts of custom plots, graphs and other analysis – click the “view data in grid” icon which is the second from the left along the bar:

view data grid button

At which point your data will be displayed in a new tab:

plotly arduino data grid

From this point you can experiment to your heart’s content – just don’t forget to save your work. In a short amount of time your data can be presented visually and analysed with ease:

plotly arduino data graph

Conclusion

Although plotly is still in beta form, it works well and the developers are responsive to any questions – so there isn’t much more to say but give it a try yourself, doing so won’t cost you anything and you can see how useful plotly is for yourself. And if you enjoyed this article, or want to introduce someone else to the interesting world of Arduino – check out my book (now in a third printing!) “Arduino Workshop”.

visit tronixlabs.com

Have fun and keep checking into tronixstuff.com. Why not follow things on twitterGoogle+, subscribe  for email updates or RSS using the links on the right-hand column, or join our forum – dedicated to the projects and related items on this website. Sign up – it’s free, helpful to each other –  and we can all learn something.
Dec
08

Will Dance For Bitcoin

api, arduino, arduino hacks, bitcoin, coinbase, python, robots hacks Comments Off on Will Dance For Bitcoin 

Bitcoin Bot

It seems that Bitcoin is all over the news nowadays, but the Bitcoin Bot is probably the first robot that will dance for Bitcoins.

[Ryan] at HeatSync Labs in Mesa, AZ, is a fan of the cryptocurrency, and decided to build something to accept it. He discovered that Coinbase, a popular hosted Bitcoin wallet service, has a callback API. This causes Coinbase to fetch a specified URL any time a wallet receives a transaction, and provides information on the transaction in the request. A Python script handles these requests and updates a running count of the BTC balance sent to the robot’s wallet.

On the hardware side, an Arduino with an Ethernet Shield checks the balance. If it has changed, it calls the dance function and the luau girl dances.

The robot sits in the window of the hackerspace, so anyone passing by can read about Bitcoin and make a donation. The source code is on Github, and a video follows after the break.


Filed under: Arduino Hacks, robots hacks
Sep
11

The Power of Temboo: connect the Yún to 100+ APIs

api, arduino, Arduino Yún, social media, temboo, Yun Comments Off on The Power of Temboo: connect the Yún to 100+ APIs 

1 - Arduino Temboo schema

(Guest post by Temboo Team)

Ever wish your Arduino could respond to the weather on the other side of the world? Or send you an email to let you know what it’s up to? Upload stuff to your Dropbox account? Or detect if you’re at risk of exposure to toxic chemicals?

Now it can. The Arduino Yún can easily grab all sorts of data and interact with tons of web-based services like Fitbit, Facebook, and Google because every Yún comes loaded with the power of Temboo. Using the Yún’s built in wi-fI capabilities, Temboo makes it easy for the Yún to connect to over 100 Application Programming Interfaces (APIs).

Don’t know what an API is or how to use one? Don’t worry. You don’t need to. With Temboo you can start using APIs with your Yún in minutes. We’ve standardized how to program with them and made sure they play nice with Arduino.

So how do you get your Yún to Temboo?

That’s easy too. When you’re setting up your Arduino account, you can quickly register for a free Temboo account right from your Arduino profile page. All you need to do for that is pick a Temboo username, and we’ll automatically email you your Temboo account details along with some ideas on where to begin. You should definitely check out the dedicated Arduino section of our website. We’ve created several how-to examples to get you Tweeting, texting, and more from your Yún in minutes. We’ve even put some examples right into the Arduino IDE (File->Examples>Bridge->Temboo).

Temboo's special page for the Arduino Yún.


Click on the image below to see one of the Temboo examples on Arduino IDE


One of the Temboo examples in the Arduino IDE.

What’s under the hood?

Temboo has written a special Python program on the Linino processor that interacts with the Temboo platform, sending and receiving data. A C++ library we created for the Arduino processor allows makers to communicate with the Linino-side Temboo program in a powerful yet user-friendly way. Sketch code for interacting with any Temboo process is generated live on our site for copying into the Arduino IDE. We’ve even developed a unique way for users to select the particular data they need from APIs and web-based resources, filtering out extraneous information and reducing the load on the board. For all the power that Temboo provides, our technology leaves a remarkably light footprint.

The Temboo website generates sketch code for the Arduino Yún. Above: Create an event on a Google Calendar.

We can’t even begin to imagine all the cool stuff that makers will do with the Yún. We’ll be adding more Arduino examples to our site as we continue to brainstorm, but we’d love to feature your ideas and projects as well. Shoot us an email at hey [at] temboo.com or tweet at us at @Temboo to tell us about what you’re working on or to ask any questions.


Jun
03

How to use Chrome’s serial API to talk with Arduino

api, arduino, chrome Comments Off on How to use Chrome’s serial API to talk with Arduino 

Api chrome

Adobe’s evangelist Renaun, created a video to explain how to use Chrome’s serial API to talk with an Arduino board as well as receive data from it. You just need to run this sketch file on your board and then run the code in Chrome. Watch the video below to hear Renaun commenting the code!


  • Newsletter

    Sign up for the PlanetArduino Newsletter, which delivers the most popular articles via e-mail to your inbox every week. Just fill in the information below and submit.

  • Like Us on Facebook