30
I have a bit of a love/hate relationship with the Arduino. But if I had two serious gripes about the original offering it was the 8-bit CPU and the lack of proper debugging support. Now there’s plenty of 32-bit support in the Arduino IDE, so that takes care of the first big issue. Taking care of having a real debugger, though, is a bit trickier. I recently set out to use one of the cheap “blue pill” STM32 ARM boards. These are available for just a few bucks from the usual Chinese sources. I picked mine up for about $6 because I wanted it in a week instead of a month. That’s still pretty inexpensive. The chip has a lot of great debugging features. Can we unlock them? You can, if you have the right approach.
The Part
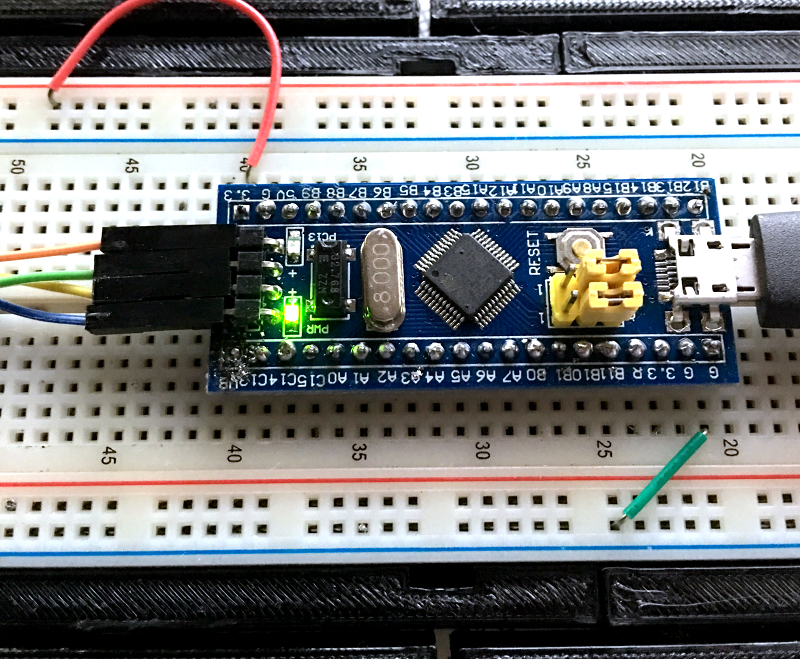
For a few bucks, you can’t complain about the hardware. The STM32F103C8T6 onboard is a Cortex-M3 processor that runs at 72 MHz. There’s 64K of flash and 20K of RAM. There’s a mini-USB that can act as a programming port (but not at first). There’s also many 5 V-tolerant pins, even though this a 3.3 V part.
You can find a lot more information on this wiki. The board is a clone–more or less–of a Maple Mini. In fact, that’s one way you can use these. You can use the serial or ST-Link port to program the Maple bootloader (all open source) and use it like a Maple. That is, you can program it via the USB cable.
From my point of view, though, I don’t want to try to debugging over the serial port and if I have the ST-Link port already set up, I don’t care about a bootloader. You can get hardware that acts as a USB to ST-Link device inexpensively, but I happen to have an STM32VLDISCOVER board hanging around. Most of the STM32 demo boards have an ST-Link programmer onboard that is made to use without the original target hardware. On some of the older boards, you had to cut traces, but most of the new ones just have two jumpers you remove when you want to use the programmer to drive another device.
The “blue pill” designation is just a common nickname referring to the Matrix, not the pharmaceuticals you see on TV ads. The board has four pins at one edge to accommodate the ST-Link interface. The pin ordering didn’t match up with the four pins on the STM32VLDISCOVER, so you can’t just use a straight four-pin cable. You also need to bring power over to the board since it will have to power the programmer, too. I took the power from the STM32VLDISCOVER board (which is getting its power from USB) and jumpered it to my breadboard since that was handy.
The Plan
Programming the board is easy — I knew the community had done a lot of work to create a support package for it. You do need a recent version of the Arduino IDE (not the one that shows up in the default Ubuntu repositories). I downloaded version 1.8.1 from the Arduino website, just to be sure. That was the first step of my general plan of attack:
- Load the latest Arduino IDE
- Set the compile messages to verbose
- Use the Board Manager to install the STM32 F1 packages
- Get more tools
- Capture the build directory
- Run the right version of GDB
The recent versions of the Arduino IDE let you select platforms by using the Board Manager (available from the Tools | Board menu). However, if you look, you won’t see this board on the list. You’ll need to tell the IDE where to get the third-party support package. To do that, you can go to the Preferences menu item (on the File menu for Windows and Linux; I understand it is on the Arduino menu on the Mac). You need this same preferences dialog for step two, also.
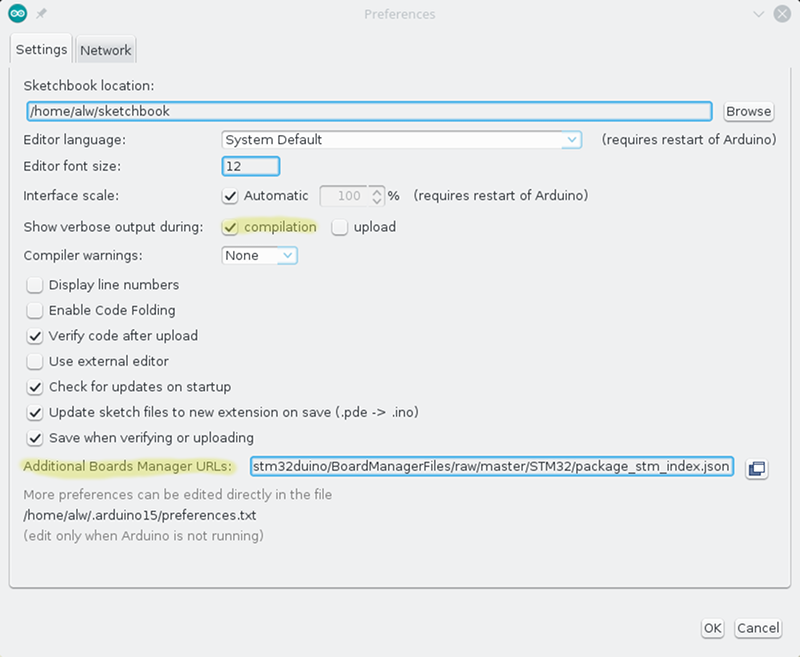 Step 2 isn’t strictly necessary, but it will make step 5 easier. Just check “Show verbose output during compilation.” What you really need to know is the temporary directory the IDE uses for your build and this is the easiest way to do that, as you’ll see.
Further down the preferences screen is an entry for “Additional Boards Manager URLs.” If there’s already something there you should click the little button to edit the list. If it is empty, you can add this URL:
https://github.com/stm32duino/BoardManagerFiles/raw/master/STM32/package_stm_index.json
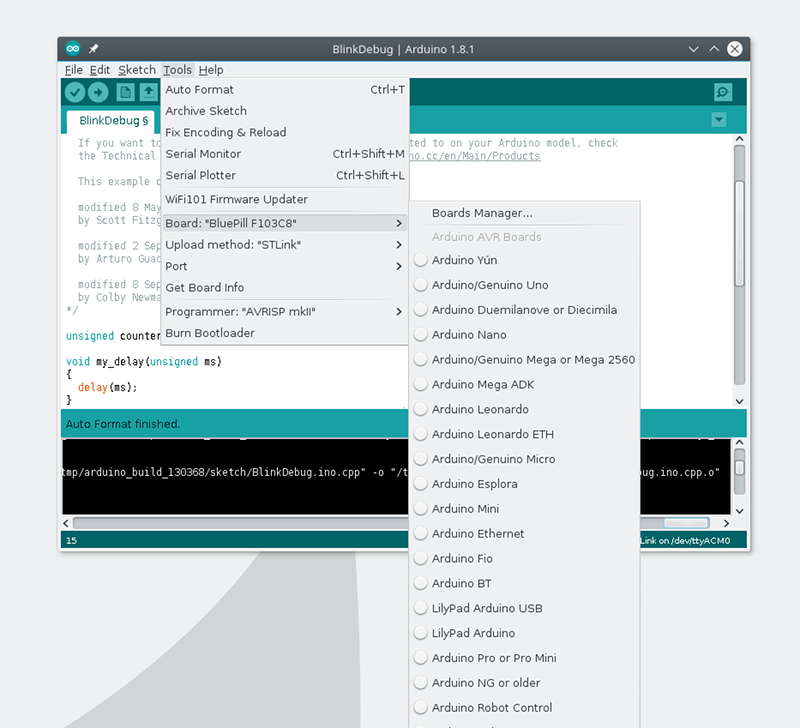
 Now you can go back to the Tools | Board menu, pick Board Manager, and search for STM. You’ll probably see a few packages (I had three) but the one for the F1 will specifically mention the blue pill. Click the button to install and wait for it to do its thing.
Once installed, you’ll have some new entries on your board menu. When you have the blue pill selected, you’ll be able to pick a few options for uploading including the one we want: ST-Link.
Coding
 The package has all the stuff you need to build and download programs using a variety of methods, including ST-Link. However, it doesn’t have the particular tool you need to do debugging.
It is simple enough to build the tools. The GitHub repo has the code and some simple build instructions. You do need libusb and CMake, but the page explains all that and once you have all the pieces, the build goes fast. For many OS choices, there are pre-built binaries you can use, too.
You’ll also need to know the USB ID of your ST-Link board and add it to the udev rules for Linux. If you don’t do this, you’ll need to be root to program the device and that’s not a good idea. However, depending on which ST-Link interface you use, it may already be there from other software or from the Arduino install. I’d try a test first and if it only works as root, you’ll need to update udev.
If you did your own build, I suggest running the tool stlink-gui to perform the test. You can also run st-info --descr
If you run stlink-gui, press the connect button with the ST-Link and blue pill powered up and connected. You should get the information about the device. If not, try as root. If that works, you need to update udev. I created a file, /etc/udev/rules.d/45-stlink.rules.
ACTION=="add" SUBSYSTEM=="usb", ATTR(idVendor)=="0483",
     ATTR(idproduct)=="3744", MODE="0666", GROUP="usbusers"
You’ll need to modify that for the USB ID of your particular interface (mine was 0483:3744; the lsusb command can help). The mode allows all users to read and write the device. I made the group owner usbusers, but since everyone can access the device that probably isn’t strictly necessary.

Once you can do all that, try running the blink sketch from the IDE examples. Be sure to pick “Upload Method: STLink” from the Tools menu of the Arduino IDE. If it doesn’t work, you may need to use the tools you just built instead of the ones that come with the Arduino IDE. Mine worked but the debugging required the custom build (because the Arduino package didn’t ship with that particular tool built).
Finding the Tools and Build Directory
The Arduino IDE is pretty friendly, so it doesn’t try to install things like boards for all users, since that would require root. The board package you loaded winds up in your home directory under ~/.arduino15/packages/STM32/tools. There’s an STM32Tools directory and a few more levels down you’ll find copies of the ST-Link tools. If they don’t work, you can manually run the tools you built in the previous step to do your uploads. When we debug, we are going to do that anyway.
What’s really important though is back under the STM32/tools directory is another directory with the compiler that the IDE uses to compile your code. There’s also a matching version of GDB — the GNU Debugger — there that you will have to use.
If you loaded an example, make sure you save it to your own directory (I hate saying sketchbook). If you don’t, the IDE will make a private copy of any changes you make and things will get confusing.
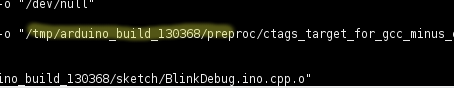
Do a build (the checkmark icon) and — assuming you checked the box in step 2 — you’ll get a lot of output from the build tools. You might verify that the compiler in use is the one we mentioned above. You’ll also see that your program gets added to other things and put in a directory named something like /tmp/arduino_build_XXXXXX where the XXXXXX is a number. Your source code will be in this directory named something like sketch/Blink.ino. In the top-level directory will be the executable Blink.ino.elf. This is what you need to debug.
If you are comfortable editing your Arduino settings file (just be sure the IDE isn’t running first) you can also force a build directory using the build.path key. The IDE does have an “export binary” command (on the Sketch menu) that compiles to your sketch folder. However, this .bin file doesn’t have enough information for the debugger.
Debugging at Last
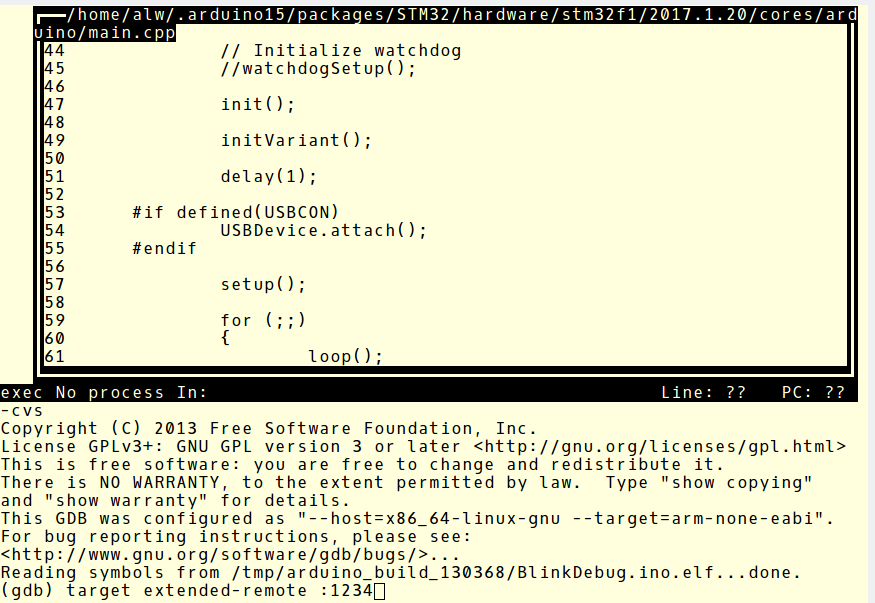
Finally, you can debug. Use the arm-none-eabi-gdb executable from the same directory as the GCC used to compile your program. This is important. If the versions don’t match you’ll get strange errors even though many things will seem to work. Provide the name of the elf file as an argument to GDB.
If you like, you can use the -tui flag to GDB to get a sort of text-based GUI. Either way, you have one more step to go. The st-util tool you built earlier can listen to the ST-Link interface and provides a socket that GDB can use to do debugging.
Start it like this:
st-util -p 1234
That will make it listen on port 1234. If you already use that port for something else, pick another one. Just remember that on Linux only root can listen on ports below 1024, so pick a bigger number.
Once that is running, you fire up GDB with your elf file name and issue the command:
target extended-remote :1234
Or, I’ve recently started using:
target remote :1234
You can run the two parts on different computers, so use a hostname if necessary (that is, devbox21:1234). Most times, the programs are on the same box and you can use localhost or omit it like I did. The difference between remote and extended-remote is that the server does not shut itself down at the end of an extended-remote session. It often works, but I have seen cases where I had to restart the server anyway, so lately I’ve been using plain-old remote to force me to restart it with each session.
A “load” command to GDB will now flash your program to the board. A typical session after a load might be:
break main
continue
list
n
n
n
The “n” command steps to the next instruction.You can find a lot more about using GDB in an earlier post. You also might find it easier to watch the walkthrough in this video:
A few caveats. First, optimization can cause your lines to execute out of order, or even go backwards. It can also cause variables to not be visible where they have been optimized out. The other thing to watch out for is that, in some cases, the debugger internally single steps. This can cause very slow execution of delay routines, for instance. You might reduce or remove delays while debugging or be careful where you try to single step instead of placing breakpoints.
Final Thoughts
It would be neat if the Arduino IDE let you debug inside of it. However, there are ways to do that using Eclipse (and GDB) or Visual Studio (if you use Windows). If you are like me and OK with the command line, you might think about using one of the Makefiles for Arduino instead of the IDE. If you aren’t OK with the command line, there are GUI shells for GDB that you could try. If you’d rather hack the ST-Link firmware, we’ve seen that done, too. If you miss doing printf’s, you might want to try a Black Magic probe, which ought to work about the same as the ST-Link interface, but also provides a serial port for printf and other mischief.
By the way, Arduino isn’t the only choice for this board. It is possible to use mBed and other development tools with them. But that’s a topic for a future post.
Filed under: Arduino Hacks, ARM


