If you only care about showing content as clearly as possible at the lowest cost, then you’ll want to turn to LCD or OLED technology. But a project’s display gives you an opportunity to get creative with the aesthetic, which opens up a whole world of different display types. If you want a retro feel, then you can inspiration in DIY GUY Chris’s gorgeous LED matrix.
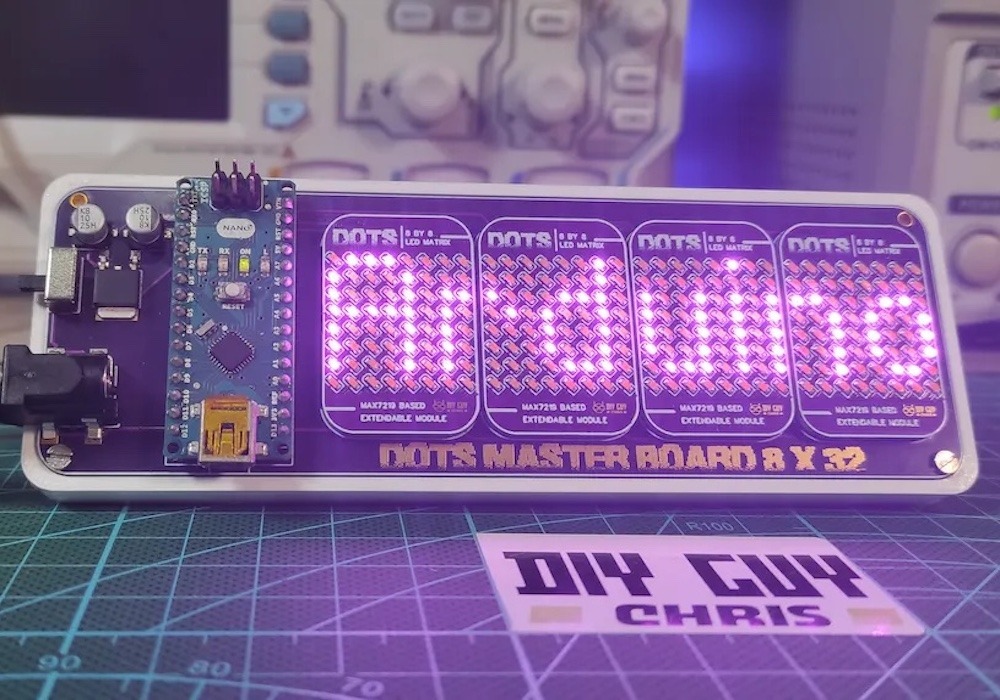
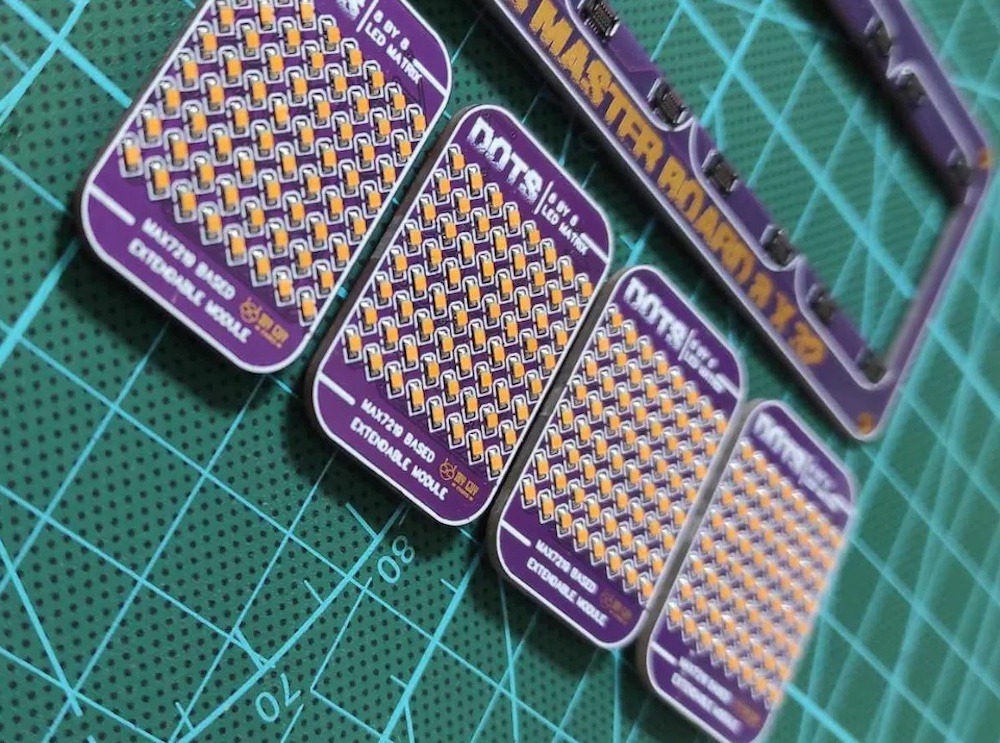
This is a dot-matrix LED display with an overall resolution of 32×8. But that description alone doesn’t do the project justice. Chris used tiny 0603 SMD LEDs, which allowed for very high “pixel” density and that results in better clarity than a typical LED matrix display. To enable future expansion, Chris set this up as a host board that accepts four LED boards — each of which contains an 8×8 matrix. A MAX7219 IC drives the LEDs on each of those boards.
The LED boards connect to the host board through nifty mezzanine connectors. The host board contains an Arduino Nano that sends control signals to the MAX7219 chips. The Arduino can supply USB power to the LEDs, but there is also a DC jack for power when USB isn’t connected. Chris’s Arduino sketch lets the user “print” alphanumeric characters to scroll across the four LED matrices.
The best part about this design (other than the great style) is that Chris can scale it up in the future with larger host boards that accept more than four LED boards.
I was intrigued by a recent project I saw that used two LED matrices placed diagonally to create an hourglass. The animated movement of the LEDs seemed a good simulation of the sand particles moving through the hourglass.
As is common, the project emphasized on how the hardware was wired together, which is trivial, without much explanation of its more challenging/interesting software aspects.
Additionally, most of the solutions I saw used an inertial position sensor to determine the position of the matrix, which seemed overkill for the simple functionality required.
So I decided to explore this topic and here is my solution.
Hourglass Basics
Hourglass
An hourglass (also known as a sand clock) is used to measure the passage of time. An hourglass is usually made up of two symmetric glass bulbs connected vertically by a narrow neck through which sand, or other suitable material, goes from the upper to the lower bulb under the action of gravity. The hourglass is turned upside-down to start another timer when all the sand runs into the bottom bulb.
Each hourglass is designed to measure a specific time interval – the time it takes to empty one bulb into the other. This time is regulated by factors that include the amount and size of the sand particles, the bulb size and the neck width.
Hardware Assembly
LED Matrices
The LED matrices are the commonly available 8×8 LED modules controlled by a MAX7219 controller. For this project the matrices with smaller PCBs that fit under the LED module are the best form factor.
Orientation Sensor
To keep things simple the orientation of the matrix is measured by a simple digital input wired to a tilt switch. These small and inexpensive sensors are available in many shapes and sizes, but all work similarly – a digital signal in one orientation and no signal for the opposite orientation, as shown in the figure below.
Internally the switch commonly has a metal ball that moves to make/break the electrical circuit.
This sensor is not able to detect intermediate states (eg, the hourglass on its side) but I am happy to live with that tradeoff compared to a much more expensive inertial sensor.
Hourglass Bezel
For testing purposes, using Fusion 360, I designed and 3D printed an hourglass shaped bezel to hold the 2 modules a jam fit.
This keeps the modules in the correct diagonal orientation with respect to each other and allows me to conveniently rotate the whole device easily.
Software Implementation
The software discussed in this section is available as the MD_MAX72xx_Hourglass example code with the MD_MAX72xx library.
Simulating the Hourglass
When thinking about this closed system, the top bulb can be considered a silo filled with sand with an exit at the bottom. As the sand passes through the neck, the sand particles above the moved particle also move into the void below and this is repeated all the way to the top of the sand reservoir.
As the mechanism is driven by gravity, it can be thought of as the particles trying to minimize their potential energy with respect to the hourglass neck.
Once the sand passes the neck it will fall (again trying to minimize the potential energy with respect to the base of the lower bulb) until it reaches the rest of the sand pile, at which time it will move over the surface of the existing pile trying to find its minimum energy state.
A good proxy for simulating the energy of each particle could be the distance between each particle and the neck/base, as potential energy is related to the height of each particle from the relevant ‘zero energy’ point.
Some Definitions
As these ‘zero energy’ point are points to which the particles are attracted, I decided to call them attractors in the software.
There are four attractors relevant to the simulation, shown in the figure at left, called HIHI, HI, LO, LOLO. When particles are travelling from the top to the bottom bulb, they are initially attracted to the HI attractor (the bottom of the top bulb) and then the LOLO attractor when they pass through the neck.
Conversely when the hourglass is turned over the attractors become the LO and HIHI attractors.
When wiring the matrices together, the module with the HI and HIHI attractor is module 0 (the first in the chain) and the other is module 1. The electrical connections are from the top to the bottom modules, as shown on the left.
Software Structure
There is a relatively simple structure to this software:
Initialization (ie, the setup() function).
Check if hourglass has changed orientation.
At the appropriate time
Moving all the particles in both bulbs
Moving a particle from the upper to the lower bulb if one is ready to drop
Updating the matrices with the new arrangement
We’ll discuss each of these in turn below.
Data Structures and Static Data
Two simple data structures are defined to help manage the simulation.
The first is small container for the row and column coordinates of a LED ‘particle’.
typedef struct
{
  int8_t r, c;
} coord_t;
The next is the definition of a particle, which comprises its coordinates on the display and the attractor that is controlling its motion.
The attractor enumerated type has the values as discussed earlier. The enumerated values are specifically nominated as they are used as the index into an array of constant coordinates for each of the attractors.
Finally, an enumerated type is defined to track the current orientation of the hourglass (ie, the direction in which the particles are flowing due to the action of gravity).
// flow direction for particles (HI->LO or LO->HI)
typedef enum
{
  FLOW_HI2LO,
  FLOW_LO2HI
} flowDirection_t;
Initialization
The particle array is statically initialized when it is declared. As the matrix is on the diagonal corner, this seemed an easier way to get a specific pattern in the top bulb at the start.
The normal hardware initialization happens in setup(), and the display is updated with the starting particle arrangement.
Check Hourglass Orientation
The hourglass orientation is given by a simple digital input from the tilt sensor. When that input changes it needs to be processed into a direction indicator (FLOW_* enumerated value) and a different attractor (ATT_*) for each particle.
For example, if a particle is in the top bulb, travelling FLOW_HI2LO directions, is currently attracted to ATT_HI. Once the flow is reversed (to FLOW_LO2HI) that particle is now attracted to HIHI.
Moving Particles
Particle moves occur periodically, controlled by the total timer duration, 30 seconds for the example code. Given that all the particles need to transition to the next bulb by the end of the period, each time slice is a total time divided by the number of particles.
For each particle, each of the 8 points surrounding the particle need to be tested to see if the particle should move into that location. A particle can move into a new location if:
The location is unoccupied.
The location is within the bounds of the hourglass bulb containing the particle.
The distance to the particle’s attractor is the minimum distance of the current set of potential locations.
The distance between the particle and its attractor is the length of the line segment that connects the two points, given by d=√((r2 – r1)² + (c2 – c1)²). As d is just for comparison the square root is unnecessary and the software uses d².
If two or more points are found to be equal minima, then a random choice is made between them.
Transition Particles
Once all the particles have moved, a special check is made to see if a particle is at the ATT_HI or ATT_LO points (depending on the flow direction).
If one is found, it is moved to the top of the lower bulb if there is no other particle there and its attractor is changed so that it travels to the bottom of the hourglass.
Display Update
The display update clears the display and then redraws all the particles at their current coordinates.
So does it work?
Given the simplicity of the approach and simulation code, the LED hourglass display looks good and works surprisingly well.
Scoreboards seem to be quite popular as beginner projects but the results are often very specific to the hardware used and very ‘hard coded’ to the original purpose.
It seemed to me that there are some parts of this style of application that are generic and probably independent to the type of scoreboard (sport and/or hardware used). I wanted to explore which parts and how this could drive a generic framework to create and update any scoreboard.
Scoreboard basics
A scoreboard is a large board, for example at a sports ground or stadium, on which the score in a game or match is displayed for the audience and participants. This display is typically square or rectangular in shape and contains all of the information relevant the sport/game such as home and guest score, game elapsed time, quarter/half indicator, other clock information, etc.
A good scoreboard is simple – it should be easy to read and quick to understand. It should contain clear information specific to the game being played and may include important game metrics. These metrics can greatly complicate the layout and size of displays for some sports – in my experience Cricket is an extreme example (shown below).
So what’s generic about this?
For simplicity I’ll just consider a sports scoreboard similar to the type shown below.
Analyzing the data displayed by this style of scoreboard, we can see a limited range of types of information:
Numeric Fields. By far the majority of information on a scoreboard consists of numeric fields.
Clocks. There is usually at least one game clock (duration or countdown) and often a second clock (eg, a shot clock in basketball).
Static Elements. These are labels (Home, Guest, Score, etc) and separation lines that don’t change during the course of the game. These invariant elements are often built into the physical construction of the scoreboard. Some labels may be static just for one match (player names, team names) and these are often handled using replaceable signs or as text fields on software driven displays.
Graphical Elements. Some data elements may be represented in graphical form such as dots, lines or icons. The underlying data is usually numeric (for example true/false or a count).
Building a framework
The framework described here is included in the scoreboard examples (the file scoreboard.h in MD_MAXPanel_SB_*) accompanying the MD_MAXPanel library. While the current framework uses a 40×32 LED panel as the scoreboard, it should be straightforward to change for alternative output hardware.
Defining the Scoreboard
For me, a useful framework takes the display and clock management functions away from the application and allows it concentrate on the functionality required for the scoreboard operator.
So, as a starting point, this means that all display field management will happen within the framework code (a C++ class in this implementation). Fields in this class are represented as a linked list of field attributes created by the application when defining the scoreboard. Each entry in the list is given a unique application defined numeric identifier id by the application.
  enum fieldType_t
  {
    NUMBER,   ///< a simple number
    MMMSS,    ///< time MMM:SS displayed
    MMSS,     ///< time MM:SS displayed
    SS        ///< time SS display only
  };

  struct field_t
  {
    uint8_t id;       ///< identifier
    fieldType_t type; ///< field type
    uint8_t x, y;     ///< field coordinates
    uint32_t value;   ///< current value of the field
    bool leadZero;    ///< field has leading zeroes
    uint8_t size;     ///< field size in characters/numbers
    field_t* next;    ///< next in the list
  };
The field has a coordinate x, y for its top left corner, a size (displayed characters), including the colon for time and leading zeroes if specified. The type of field determines how to interpret and display its current value. For clocks the current time is uniformly stored in seconds but can be displayed in the different formats specified.
A clock is a field that has associated with it additional information. A game clock will have a timeLimit it counts up to (or down from), a boolean status of whether it is stopped, and some in ternal management.
  struct clock_t
  {
    field_t* f;           ///< field associated with this timer
    uint32_t timeLimit;   ///< upper limit for time
    uint32_t timeLast;    ///< last time displayed/updated
    uint32_t timeToGo;    ///< time to go before next update
    bool countUp;         ///< counting up if true
    bool stopped;         ///< true if stopped
  };
To define a scoreboard an application needs to define the displayed fields (using fieldCreate()) and then associate a clock with those fields that are clocks (clockCreate()).
Managing Field Values
Fields only contain numeric values, so simple class methods to manage each field are fieldSetValue(), fieldGetValue() and fieldValueAdd() which do the obvious suggested by the method name.
Managing Clocks
For the clock fields the value is managed by the class rather than the application, although the field*() methods will still work correctly.
The clock value is incremented or decremented each second by the class. The application manipulates the status of a clock using
clockStart() to stat the clock running.
clockStop() to stop the clock running.
clockToggle() to runs the clock if stopped and stops it if running.
clockReset() to set the clock to the appropriate value depending on whether it is counting up or down.
isClockRunning() to check its run status.
Display Updates
The application repeatedly calls the update() method to allow the class to run its management functions and update the display as required.
Updates are optimized to only change the display hardware when there has been a change to the scoreboard data. All changes occurring between after a call to update() are output at the next call to update().
Sample Applications
Simple scoreboard
The first application is a simple scoreboard showing 2 scores and a clock in MMSS format that counts up from zero time (example code MD_MAXPanel_SB_Simple).
The layout was planned using a spreadsheet to locate the fields and static elements of the display.
The prototype operator interface consists of a few tact switches managed by the MD_UISwitch library as follows:
Clock Control – one switch to start and stop the clock. A long press resets the clock to zero.
Score Up – one switch per score field to add +1 to the score.
Score Down – One switch per score field to add -1 to the score. A long press resets the associated score to zero.
The final scoreboard is shown below. The static elements (lines) are drawn by the application during initialization.
Basketball scoreboard
To test the framework concepts further a more complex basketball scoreboard was created with 2 different clocks, more fields, more static elements and some graphical output (example code MD_MAXPanel_SB_BBall).
The display was planned on a spreadsheet, as before.
The operator interface consists of a few tact switches managed by the MD_UISwitch library as follows:
Clock Control – one switch to start and stop the clock. A long press resets the clock to zero.
Period Count Up – Increment the period counter. Once it reaches 4 it resets back to 0. The period is shown graphically as a sequence of 4 rectangles under the shot clock.
Timeout Count Up – One switch per team to add +1 to the timeouts. Timeouts are reset to 0 once they reach 2. Timeouts are shown graphically as a line of 3 dots above the score.
Score Up – One switch per score field to add +1 to the score.
Score Down – One switch per score field to add -1 to the score. A long press resets the associated score to zero.
Team Foul Up – One switch to increment the team foul count. Once this reaches 9 it resets to 0.
Shot Clock Reset – One switch top reset the shot clock.
Shot Clock Start/Stop – One switch to start and stop the shot clock.
Graphical elements are managed by the application as I could not find a ‘nice’ way to do this in the management class without creating excessive complexity in the class and how it is used.
The final scoreboard is shown below.
Conclusion
The results from this experiment are a bit of a mixed bag for me.
In simple applications, just showing scores and clocks, the framework works well and is a useful tool to simplify the management of the scoreboard.
However, if scoreboard graphical elements are included, I feel that the application still needs to do too much work outside of the management class, bringing it back into the ‘hard coded’ territory I was trying to avoid at the outset.
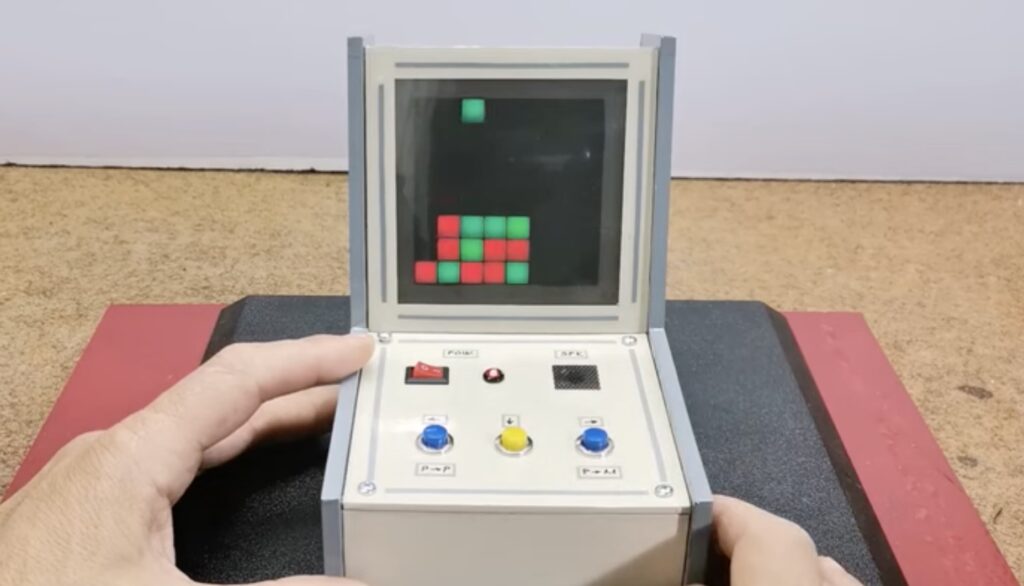
The childhood classic tabletop game of Connect Four entails dropping either a red or yellow disc into one of several columns in a grid with the hope of lining up four in a row. And even though the game has existed digitally for a while now, it is mostly played on LCD screens with fancier graphics and AIs against which the player competes. Wanting to push this paradigm further, Mirko Pavleski built a mini tabletop arcade cabinet that uses an Arduino Nano and an LED matrix instead to run the game.
In order to display the current grid to the player(s), Pavleski purchased an 8×8 WS2812B individually addressable LED matrix that gets powered by the Arduino Nano‘s 5V regulator. Because the game can either be played against another human or an AI opponent, the cabinet contains three buttons for selecting the chip’s drop location and a buzzer to deliver audible feedback when an event occurs. The entire device was constructed from a few 5mm PVC boards lined with colored paper for an old-fashioned aesthetic.
Watching the microcontroller AI opponent play Connect Four in real-time is quite impressive, owing to the relatively small computing resources of the Arduino Nano’s ATmega328 MCU. To see it in action, you can watch Pavleski’s video below or check out his project write-up on Hackster.io.
Rock/Paper/Scissors (RPS) is a game using simple rules and a circular winning strategy that I thought would be interesting to code. Additionally, there is an element of suspense/anticipation to the game that adds to its enjoyment, and I challenged myself with trying to capture this part of the experience as well.
So, during a few of the many recent rainy days I decided to spend some time seeing what I could do with an Arduino Uno, some tact switches and a few LED matrix modules.
I expect that most readers are familiar with this game, so here is a brief summary of the rules.
RPS is a hand game usually played between two people in which each player simultaneously forms one of three shapes with their hand. These shapes are a closed fist, a flat hand, and a fist with index and middle fingers forming a V (representing rock, paper and scissors respectively).
The game has three possible outcomes – win, draw or loss – based on the following simple rules:
Rock beats scissors (rock ‘breaks’ scissors).
Paper beats rock (paper ‘covers’ rock).
Scissors beats paper (scissors ‘cuts’ paper).
If both players form the same shape the result is a draw.
When the game is played with more than two players, everyone in the group plays their hand as in the two-player game, but the result is determined by the following additional rules:
Everyone plays again if all shapes are the same or all three shapes are shown (ie, 1 shape or 3 shapes are shown).
If only two shapes are showing, the rules for two players are applied to each group’s shape and players in the winning group remain in the game.
When only two players remain, the rules revert to the normal two-player game.
An important aspect of the game experience is the countdown (1, 2, 3 or Ready, Set, Go) before each player simultaneously shows their hand, followed by the quick survey of hands to determine the winner.
Hardware
To keep things really simple, each player has three to select the shape they choose for the next turn (R, P or S). These switches don’t need to be debounced as we are only interested in knowing the switch has been activated. Once this is detected, the player’s turn is complete until the next run of the game. This implementation allows up to four players and so needs 12 switches.
Gameplay is displayed on 8×8 LED modules, one module per player. The displays are connected using the hardware SPI interface and managed by the MD_MAX72xx library.
The photo below shows the setup using my prototyping system (described in this earlier post) connected to an Arduino Uno.
Programming
Breaking it Down
For the purposes of organizing the play sequence, each play session is divided into 3 separate parts.
A Session is the entire sequence from when the processor is reset to the next time it is reset. The number of players (between 1 and 4) is selected at the start of the session and is fixed for its duration.
A Game is a sequence of Runs (defined below) that result in one winner. At the end of a Game the winner is shown on the display and a new Game is started.
A Run is a sequence of player turns. When multiple players are involved, individuals may be excluded from the succeeding Runs until the end of a Game, at which time they are start participating again.
The LED displays show a sequence of symbols to direct the game and some basic animation to convey status.
The icon (glyphs) used are managed as characters in a MD_MAX72xx font definition. The small number of resources required were designed using a Microsoft Excel spreadsheet.
Glyph Design
The use of an Excel sheet is a variation on the technique discussed here.
Cells in the sheet were conditionally formatted to show a red ‘LED’ icon when the cell is 1 and an empty ‘LED’ when 0. A spreadsheet formula creates the numeric for each column and another formula concatenates the codes into a cut-and-paste format for the font definition. These are shown in the image below.
This method makes it easy to visualize and create the data for LED patterns, especially when only a few bitmaps are needed. The spreadsheet is included with the code. (Yes, the scissors are impossible …)
Flow and Interaction
The game sequencing is organized as a finite state machine implemented in the loop() function.
Session Initialization
The Session phase is used to initialize the number of players. The Rock switch for Player 1 is used to cycle through choices for 1P, 2P, 3P or 4P to select the number of human players. The selection is completed when either of the other 2 switches are pressed.
If 1P is selected, the Arduino becomes the second player and will automatically takes its turn after a countdown.
Switches for unused players are not scanned for the duration of the Session and their associated displays remain blank.
Game Initialization
A Game encapsulates a number of Runs. At the start of a Game all valid players are initialized to their start state. Group players that may have been excluded during the previous Runs are brought back into the new Game.
Run Cycle
The Run cycle are where most of the game interactions occur.
The start of a Run is a Ready/Set/Go display where all valid player’s displays show an animated square decreasing in size until it is at the center.
At that point, the players are allowed to make their choice using one of their RPS switches. As each player makes their choice the center dot display expands into a square (both shown in the image below) so that all players can keep track of progress.
This simple countdown and animation sequence is quite effective at capturing the feeling of an actual game’s Ready/Set/Go phase.
Once all players have made their choice, the outcome of the game is simultaneously displayed to all players (shown below).
For a 2-player game, if the Run results in a winner, the winning player’s display is flashed a number of times and a new Game is started.
For multi player games, the result of a Run meets the criteria for a winning group, all the players in the losing group are excluded from further runs and their displays show an ‘X’ to indicate this exclusion. The remaining players then participate in the next Run.
Keeping Track of Players
As well as game sequencing, players are managed by being in assigned status during play:
Unused if the player was not selected for the Session. For example, players 3 and 4 of a 2 player game.
Neutral if they are participating in a Run before a result.
A Winner, Loser or Drawn once a run is completed and a result is determined.
Out of the game and not able to participate in a Run.
Any player that loses during a Run is categorised as out at the end of the run. A Game ends when only one player remains not out.
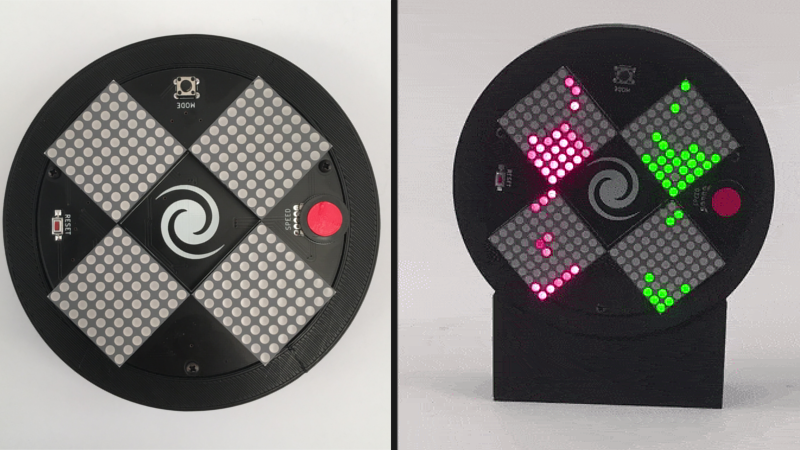
[Fearless Night]’s slick dual hourglass doesn’t just simulate sand with LEDs, it also emulates the effects of gravity on those simulated particles and offers a few different mode options.
The unit uses an Arduino (with ATMEGA328P) and an MPU-6050 accelerometer breakout board to sense orientation and movement, and the rest is just a matter of software. Both the Arduino and the MPU-6050 board are readily available and not particularly expensive, and the LED matrix displays are just 8×8 arrays of red/green LEDs, each driven by a HT16K33 LED controller IC.
The enclosure and stand are both 3D-printed, and a PCB not only mounts the components but also serves as a top cover, with the silkscreen layer of the PCB making for some handy labels. It’s a clever way to make the PCB pull double-duty, which is a technique [Fearless Night] also used on their earlier optical theremin design.
Those looking to make one of their own will find all the design files and source code handily available from the project page. It might not be able to tell time in the classical sense, but seeing the hourglass displays react to the device’s orientation is a really neat effect.
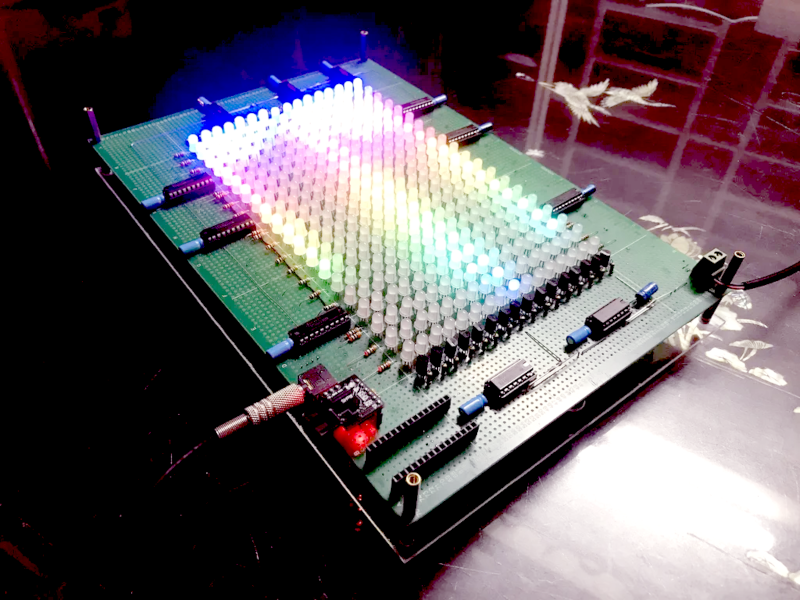
You would think the hard part about creating a spectrum analyzer using a pint-sized ATTiny85 would be the software. But for [tuenhidiy], we suspect the hard part was fabricating an array of 320 LEDs that the little processor can drive. The design does work though, as you can see in the video below.
The key is to use a TPIC6B595N which is an 8-bit shift register made to drive non-logic outputs. With all outputs on, the driving FETs can supply 150 mA per channel and the device can handle 500 mA per channel peak. At room temperature, the part can go over 1W of total power dissipation, although that goes down with temperature, of course. If you need higher power, there’s a DW-variant of the part that can handle a few hundred milliwatts more.
A fixed-point FFT library does the actual work. The program simply reads samples, processes the FFT, and drives the LEDs through the shift registers.
The construction technique is also a bit interesting as much of the wiring is left over LED leads. We admire the neat work, but we think we’d have had better luck with PCB traces.
Although billed as a spectrum analyzer, a device like this is really more of a music visualizer. If you want a real spectrum analyzer, they have become reasonably cheap. As impractical as the LED grid is for practical output, it beats ping pong balls.
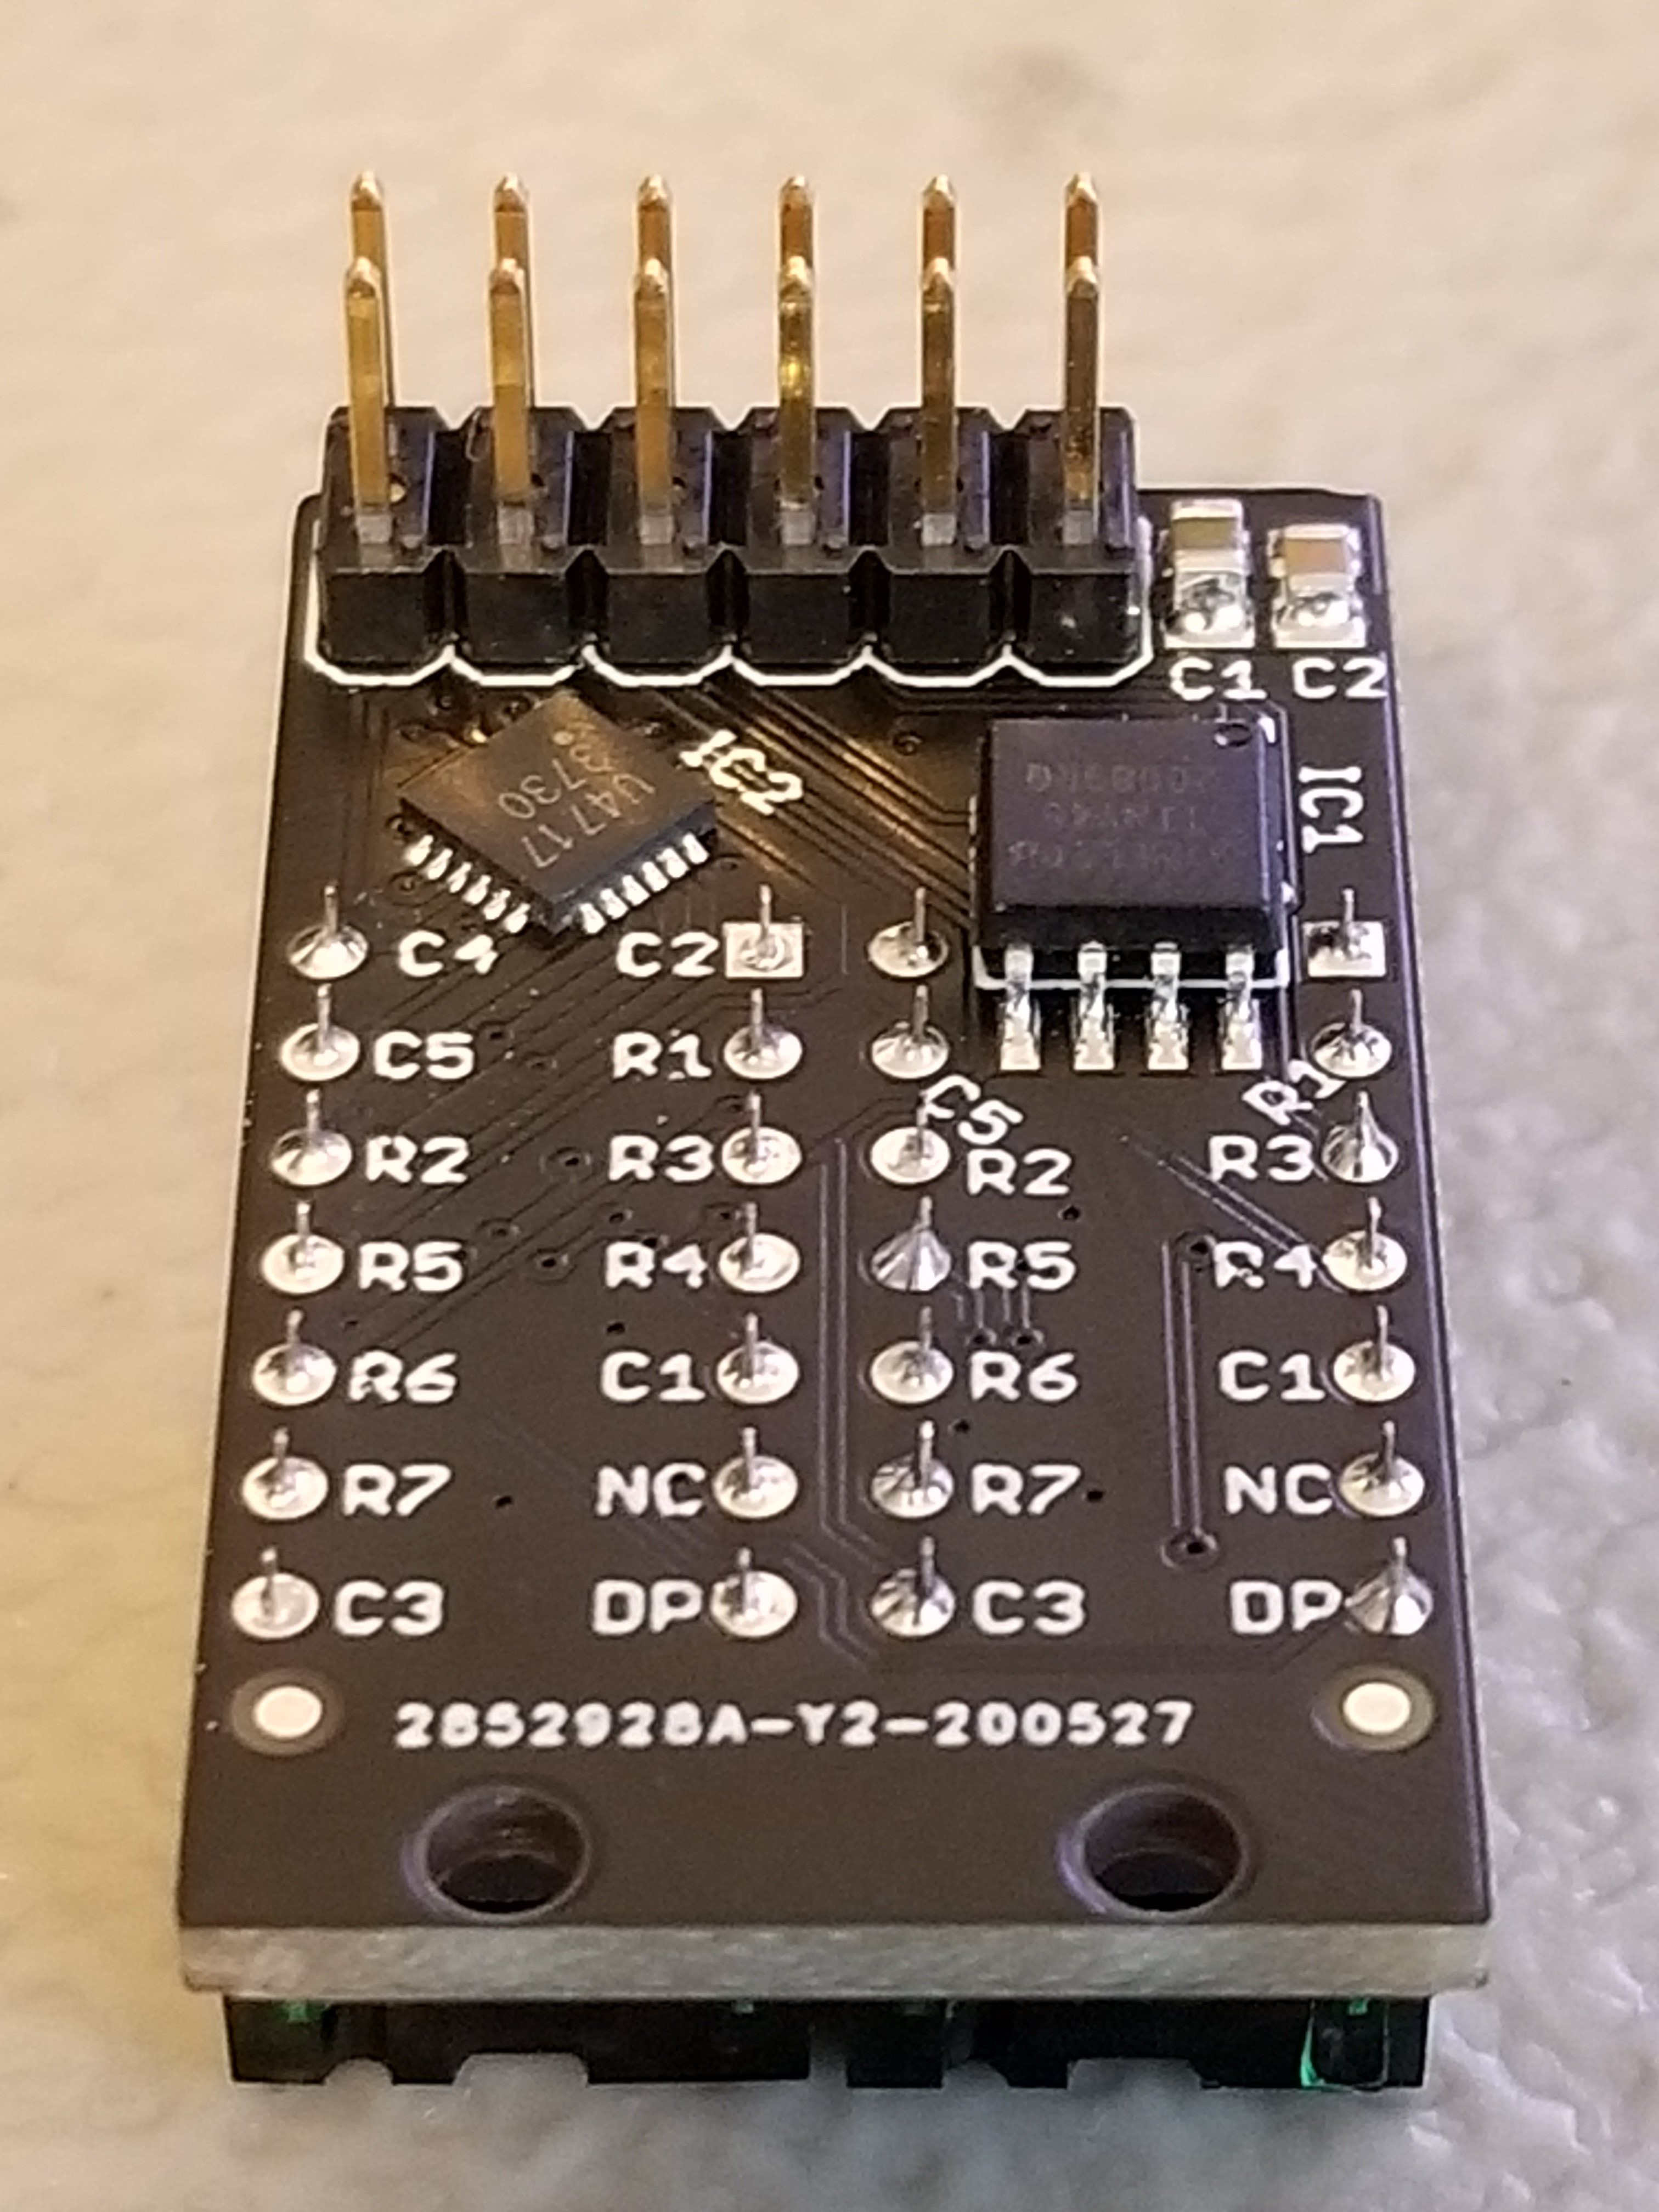
When we last heard from [lixielabs] he was building Nixie tube replacements out of etched acrylic and LEDs. Well he’s moved forward a few decades to bring us the Pixie, a chainable, addressable backpack for tiny LED matrix displays.
Each Pixie module is designed to host two gorgeous little Lite-On LTP-305G/HR 5×7 LED dot matrix displays, which we suspect have been impulse purchases in many a shopping cart. Along with the displays there is a small matrix controller and an ATTINY45 to expose a friendly electrical interface. Each module is designed to be mounted edge to edge and daisy chained out to 12 or more (with two displays each) for a flexible display any size you need. But to address the entire array only two control pins are required (data and clock).
[lixielabs] has done the legwork to make using those pins as easy as possible. He is careful to point out the importance of a good SDK and provides handy Arduino libraries for common microcontrollers and a reference implementation for the Raspberry Pi that should be easy to crib from to support new platforms. To go with that library support is superb documentation in the form of a datasheet (complete with dimensions and schematic!) and well stocked GitHub repo with examples and more.
To get a sense of their graphical capabilities, check out a video of 6 Pixie’s acting as a VU meter after the break. The Pixie looks like what you get when a hacker gets frustrated at reinventing LED dot matrix control for every project and decided to solve it once and for all. The design is clean, well documented, and extremely functional. We’re excited to see what comes next!
For some reason, when slot machines went digital, they lost their best feature — the handle. Who wants to push a button on a slot machine, anyway? Might as well just play video poker. [John Bradnam] seems to agree, and has built an open-source three-color matrix slot machine complete with handle.
In this case, you’ll be losing all of your nickels to an Arduino Pro Mini. The handle is an upgrade to an earlier slot machine project that uses three 8×8 matrices and a custom driver board. When the spring-loaded handle is pulled, it strikes a micro switch to spins the reels and then snaps back into place. Between each pull, the current score is displayed across the matrix. There’s even a piezo buzzer for victory squawks. We only wish the button under the handle were of the clickier variety, just for the feels. Check out the short demo video after the break.
Planet Arduino is, or at the moment is wishing to become, an aggregation of public weblogs from around the world written by people who develop, play, think on Arduino platform and his son. The opinions expressed in those weblogs and hence this aggregation are those of the original authors. Entries on this page are owned by their authors. We do not edit, endorse or vouch for the contents of individual posts. For more information about Arduino please visit www.arduino.cc
You are currently browsing the archives for the LED matrix category.


 Each Pixie module is designed to host two gorgeous little
 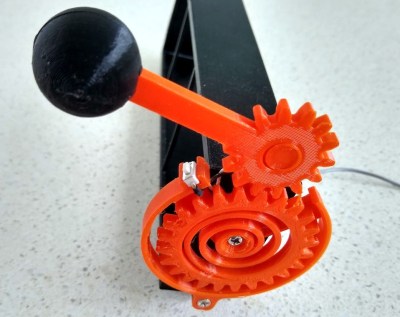 In this case, you’ll be losing all of your nickels to an Arduino Pro Mini. The handle is an upgrade to an earlier slot machine project that uses three 8×8 matrices and a custom driver board. When the spring-loaded handle is pulled, it strikes a micro switch to spins the reels and then snaps back into place. Between each pull, the current score is displayed across the matrix. There’s even a piezo buzzer for victory squawks. We only wish the button under the handle were of the clickier variety, just for the feels. Check out the short demo video after the break.
