In the rapidly evolving landscape of industrial technology, three interesting trends are intertwining to streamline processes, improve efficiency, and reduce downtime. They are retrofitting, remote control/monitoring, and power metering – and together, they make for a great strategy to upgrade and improve existing machinery, reaping all the benefits of connected things and data analysis without the huge investment of completely new equipment.
Retrofitting industrial machinery Retrofitting industrial machinery involves updating existing equipment with modern technology to enhance functionality and performance. It allows businesses to extend the lifespan of their machinery while adapting to evolving industry standards and requirements.
Remote monitoring and control Remote monitoring and control enable businesses to oversee their operations from anywhere in the world. This capability not only improves operational efficiency but also facilitates proactive decision-making and troubleshooting, ultimately reducing costs and downtime.
Power metering Power metering entails tracking and analyzing energy consumption. By monitoring power usage, businesses can identify areas for optimization, reduce waste, and lower energy costs, contributing to sustainability efforts and improving their own bottom line at the same time.
Our latest demo showcases the seamless integration of these three crucial aspects into a single solution, using Arduino technology.
The demo in detail
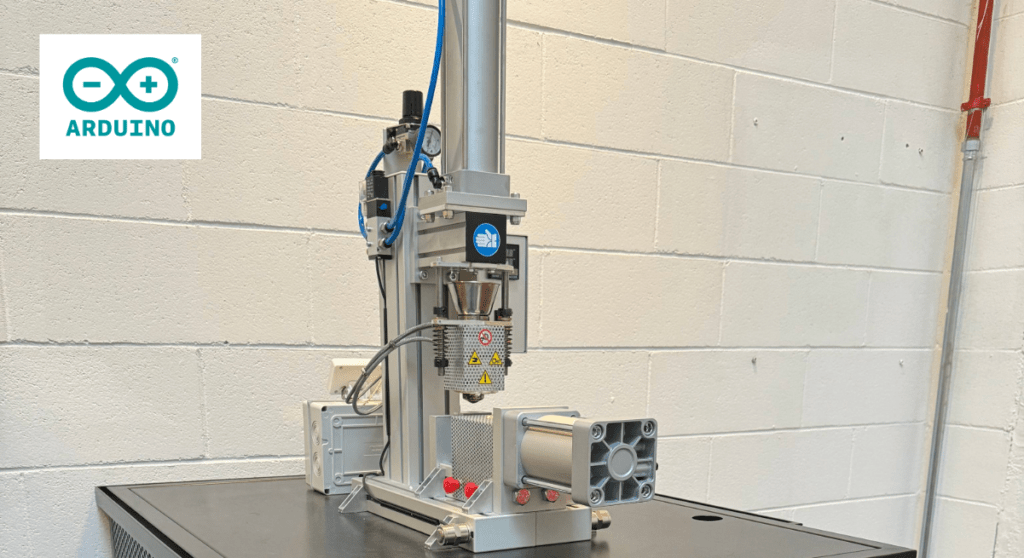
We focused on retrofitting an injection molding machine – a common piece of industrial equipment – with advanced automation capabilities. By replacing the original controller with the Arduino Opta WiFi micro PLC, we transformed the machine into a connected device.
Now, integrating with the Arduino Cloud, users can monitor and control the injection molding machine remotely via intuitive dashboards. This connectivity allows for real-time oversight of production cycles, performance metrics, and equipment status from anywhere with an Internet connection.
Additionally, the Arduino Opta WiFi is equipped with RS485 communication capabilities, enabling seamless integration with an external power meter – in our case, a Finder model. This provides valuable insights into energy consumption, production output, material usage, and equipment health.
The collected data is then analyzed through dedicated dashboards, offering information about operational efficiency and potential issues. By leveraging this data, businesses can proactively schedule maintenance and repairs, minimizing downtime and optimizing production processes.
Retrofitting for a connected future
Many businesses today can retrofit existing machinery to embrace the benefits of connectivity and automation. Our demo provides a practical example of how common industrial equipment can become smarter, more efficient, and easier to manage. From remote monitoring and control to power metering and predictive maintenance, retrofitting offers a sustainable way to modernize industrial infrastructure.
Unlocking potential across industries
Moreover, the versatility of Arduino’s open-source ecosystem ensures that this solution can be adapted and applied to a wide range of existing machines and equipment, enhancing their operation effectively – whether in manufacturing, logistics, or any other industry relying on machinery.
To learn more about how you can leverage Arduino technology to upgrade your infrastructure and achieve tangible results, contact us today. Let us help you unlock the full potential of your industrial assets with practical, cost-effective solutions.
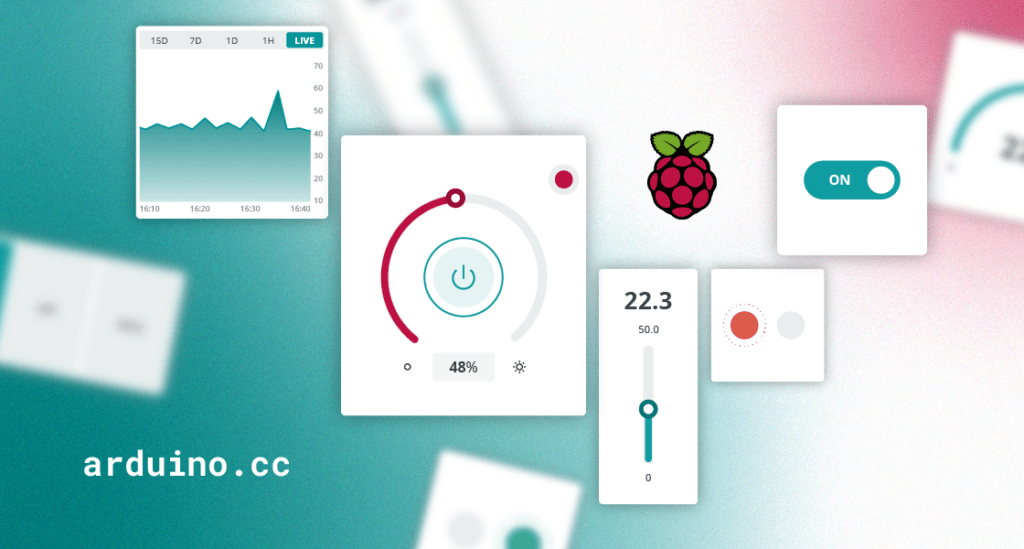
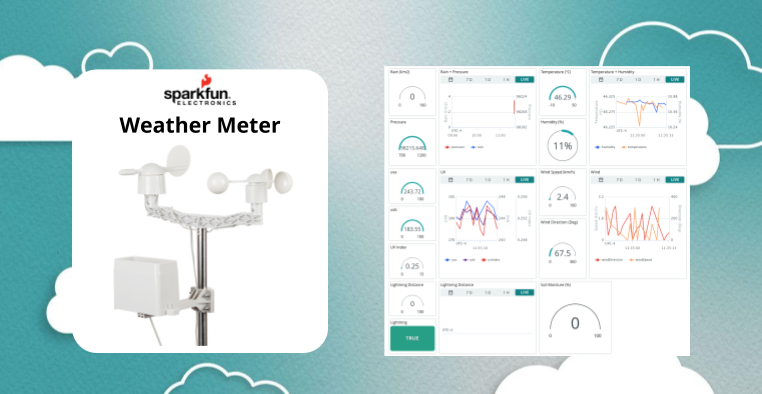
Hey there, DIY IoT enthusiasts! Ever build a cool gadget with your Raspberry Pi, only to get stuck figuring out how to show off its data? Don’t worry, you’re not alone. Lots of makers like you face the same challenge: turning that awesome sensor data into something easy to see and interact with on your phone or laptop.
The good news is, there are simple and reliable ways to bridge that gap and shed light on your data without losing time.
Visualize your Raspberry Pi data: Get started
Raspberry Pi and other Linux-based platforms have become popular in the IoT space due to their versatility and ease of use. However, a common issue is finding an effective way to visualize their data and connect them to visualization platforms.
At the end of the day, what do you want? You have your code which is producing data and you want to have a dashboard to visualize it both in real time and its historical evolution. Furthermore, you would like to interact directly with your application from that dashboard too!
Let’s explore what kind of solutions you have at your disposal.
Choosing a visualization platform for your Raspberry Pi
You can visualize your device’s data by installing a visualization platform on your device or sending data to an external platform, self- or cloud-hosted. Each has its pros and cons, and the choice depends on your skills, time, and the complexity of the solution.
Installing a visualization platform on your device also implies setting up local data storage, like a database. This process along with the platform installation and maintenance can be complex and time-consuming, especially for beginners.
Transferring data to an external platform is typically easier as they usually offer a simple API to interact with them, but the type of solution can add complexity:
If you opt to establish your own platform and infrastructure, it may seem like you have more control over the solution. However, it can quickly become an overwhelming task for beginners, and ongoing maintenance can be even more challenging.
Choosing a cloud-hosted solution often seems like the most balanced option. However, it can also be complicated due to the wide range of alternatives, varying levels of complexity, and pricing models that can be difficult to understand.
Some of these alternatives were also described in a previous article, where we explored several ways to visualize data coming from Arduino or ESP32 based boards.
Choosing the right programming language for your Raspberry Pi
But now, what? You have to program your application to collect data. Selecting the right programming language can depend on many different factors. Knowledge of the environment or simply your preference can be a deciding factor. But sometimes the decision is not so simple. Here we have some insights about some popular IoT programming languages
Python: Python is a top choice for IoT development due to its simplicity, rich library ecosystem, and active community. Its dominance in AI allows seamless integration of machine learning models.
JavaScript: JavaScript, with Node.js as a server-side runtime environment, is also a go-to language for IoT device development. It’s versatile and its event-driven nature aligns seamlessly with IoT requirements. It’s particularly popular for applications that interact with web pages, thanks to the potential for significant code reuse.
Node-RED: Lastly, low-code programming environments like Node-RED have become very popular for IoT. It allows you to create your applications with an intuitive drag-and-drop interface, connecting hardware and platforms, and controlling anything from tiny sensors to the cloud.
Note: While other languages like C/C++ and Rust are also relevant, this blog post focuses on Python, JavaScript, and Node-RED due to their popularity and relative ease of use.
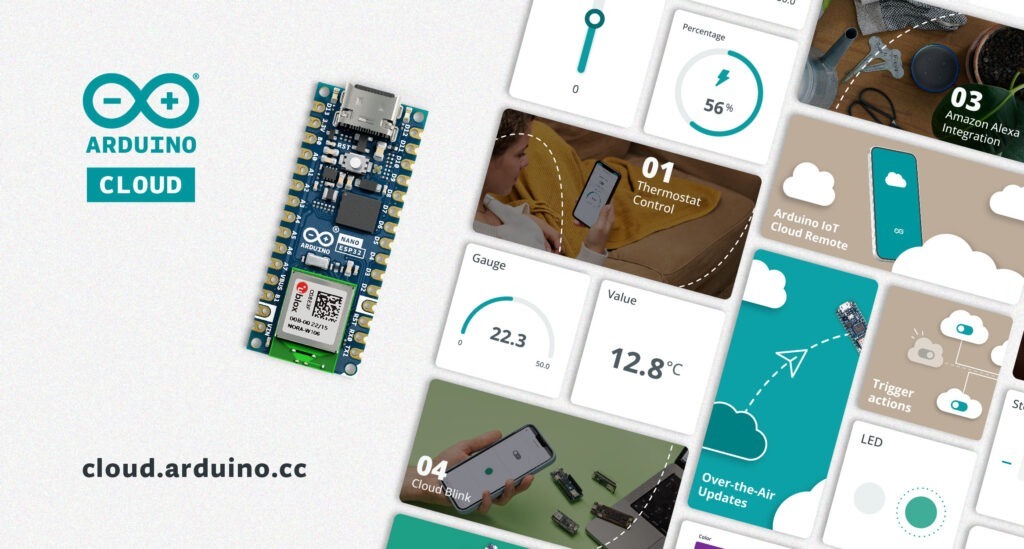
Creating IoT monitoring dashboards with Arduino Cloud
The Arduino Cloud is a cloud-hosted platform that provides a user-friendly environment to create customizable insightful dashboards used to monitor and control your IoT devices.
The main benefit is its ease of use. You get rid of installation or maintenance headaches, while you connect your devices in minutes and visualize the data in your dashboards either from your browser or your mobile phone. You can create and customize your dashboards with an intuitive interface using drag-and-drop widgets. These dashboards provide real time interaction with your IoT devices and insightful historical information that can be additionally downloaded for offline analysis.
But there are many other cool features:
Real time alerts: You can receive notifications based on criteria configured in the Cloud. Learn more in this post.
Mobile phone app: You can access your dashboards using the IoT Remote app.
Work collaboratively: You can share your code and dashboards with others.
Out-of-the box integrations: You have seamless integration with popular platforms like IFTTT, Zapier, Google Services, Alexa or Google Home.
Want to learn more? Check out this recent article announcing four new IoT monitoring dashboard features that may seem small, but pack a big punch for your connected projects. They include the ability to duplicate IoT Dashboards, IoT Value Widget customization, new data aggregation method and more.
How to connect your Raspberry Pi to Arduino Cloud
Connecting your Raspberry Pi to Arduino Cloud couldn’t be easier. You only have to follow these steps:
1. Set up an Arduino Cloud account. 2. Add your device to the Arduino Cloud as a Manual device. 3. Create your Thing and add your variables. 4. Create the code for your Raspberry Pi using your preferred development language and environment. 5. Create the dashboards for data visualization.
So, do you want to remotely monitor your Raspberry Pi creations and control them from anywhere? Stay tuned! Upcoming posts will showcase real-world examples of connecting your Raspberry Pi to the Arduino Cloud, enabling you to visualize sensor data and interact with your projects remotely. In the meantime, here’s a project from ProjectHub showing an integration with Raspberry PI using Python to show VCO2 data from a SGP30 sensor.
Start with Arduino Cloud for Free
Arduino Cloud is free to use. So, if you’re looking to streamline data visualization of your Raspberry Pi applications, consider giving the Arduino Cloud a try and leverage its full potential for your projects. You can explore the premium features for enhanced functionality.
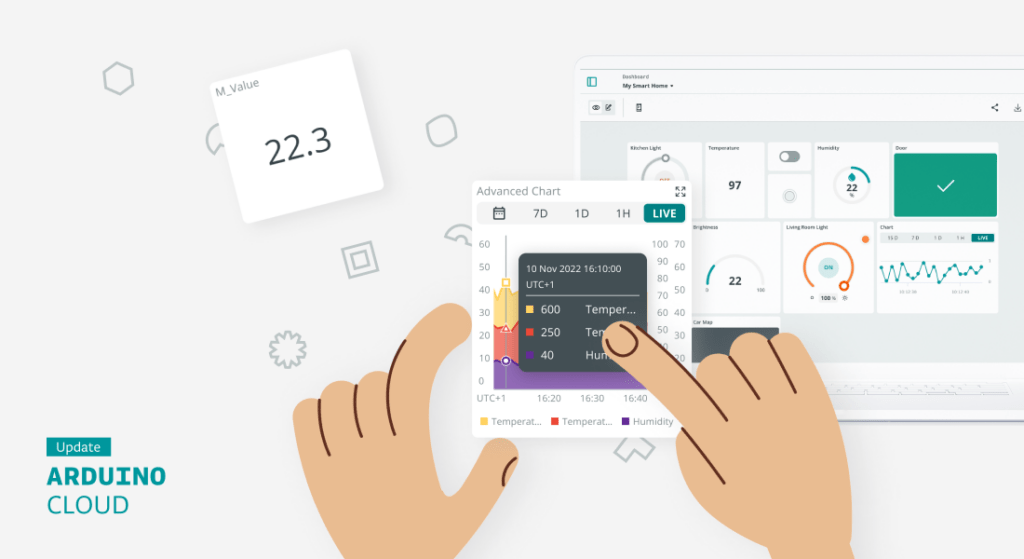
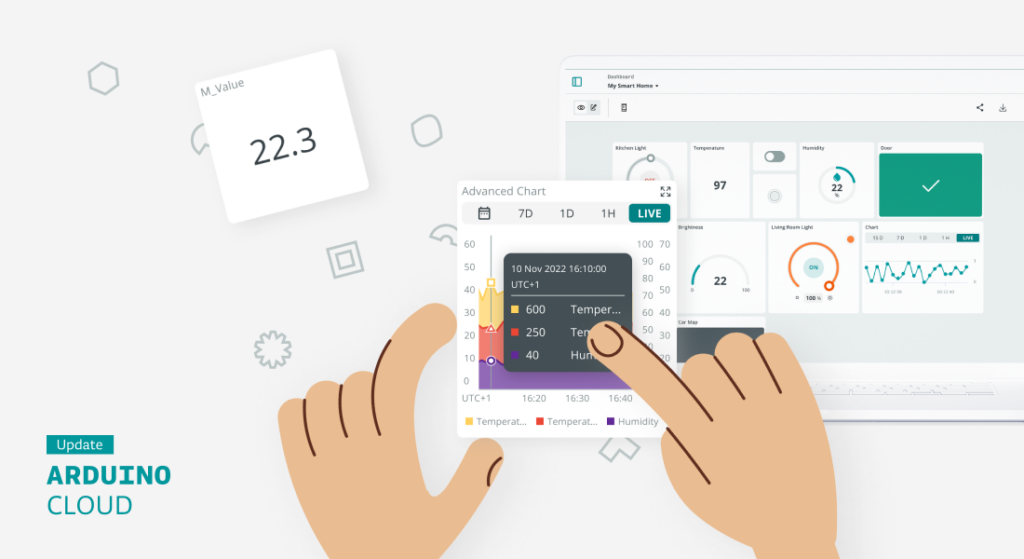
Arduino Cloud recently received a major upgrade renewing the user interface and the Arduino Cloud editor. And as we promised it was just the beginning. This article dives into some of the new IoT monitoring dashboard features that may seem small, but pack a big punch for your connected projects.
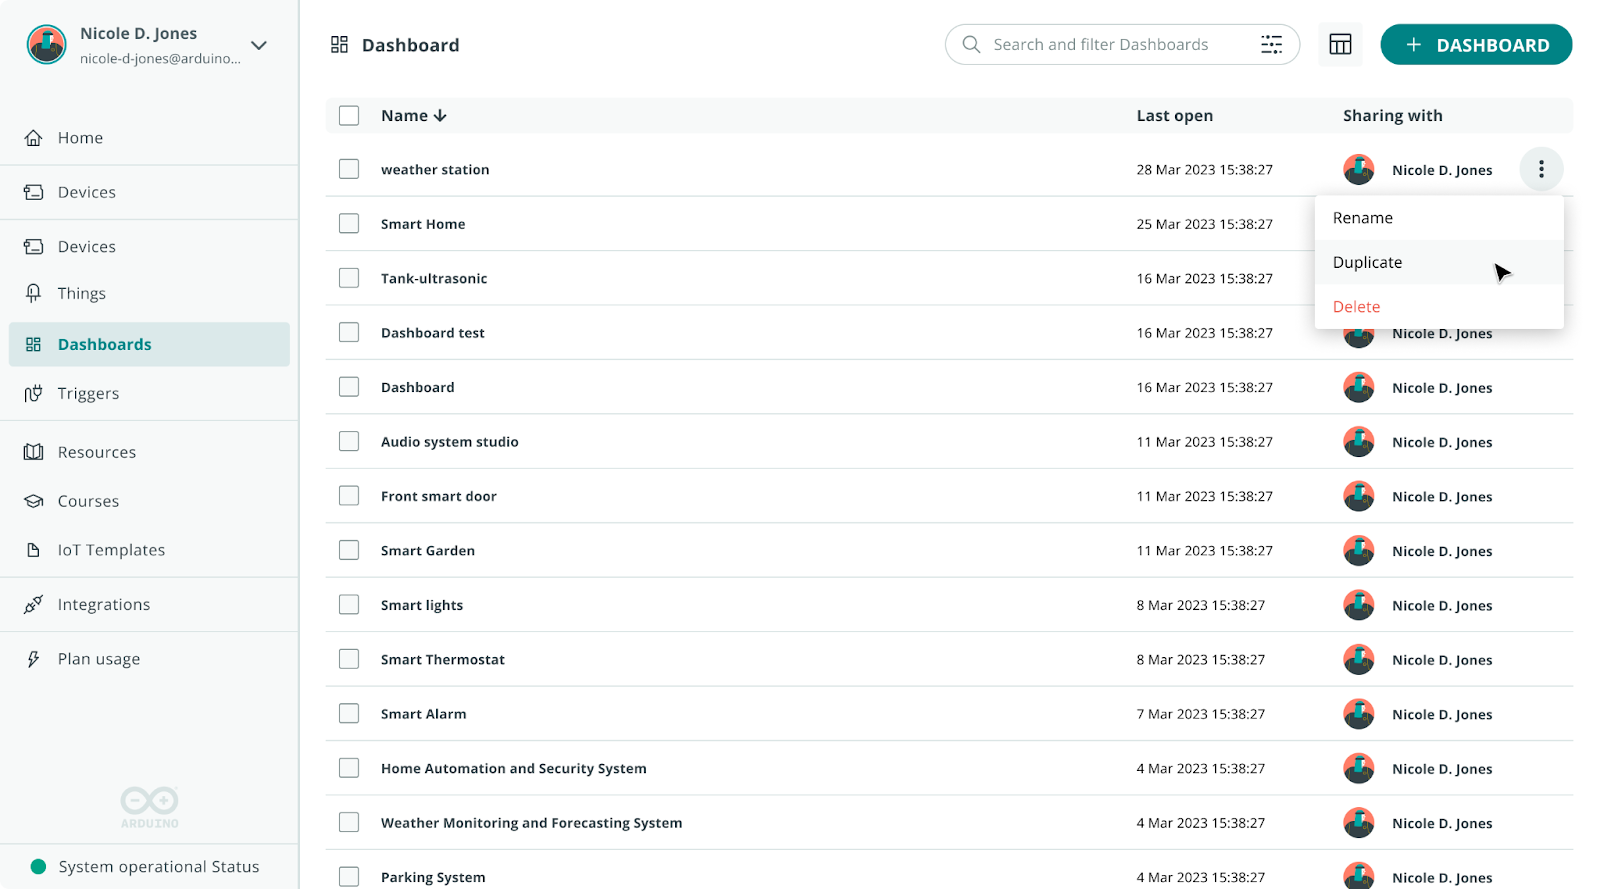
1. Duplicate IoT Dashboards
Dashboards are the heart of the Arduino Cloud, allowing you to effortlessly monitor and control your devices. That’s why improving their functionality is crucial.
Even though creating an IoT dashboard is an easy task with the intuitive drag-and-drop interface, it can become a bit tedious when you have to replicate many of them and apply minor adjustments.
Now it is possible to duplicate your IoT dashboards with just one click. Just click on the three dots (?) of the dashboard that you want to clone and select “Duplicate.” This creates a copy that you can customize to meet your specific needs.
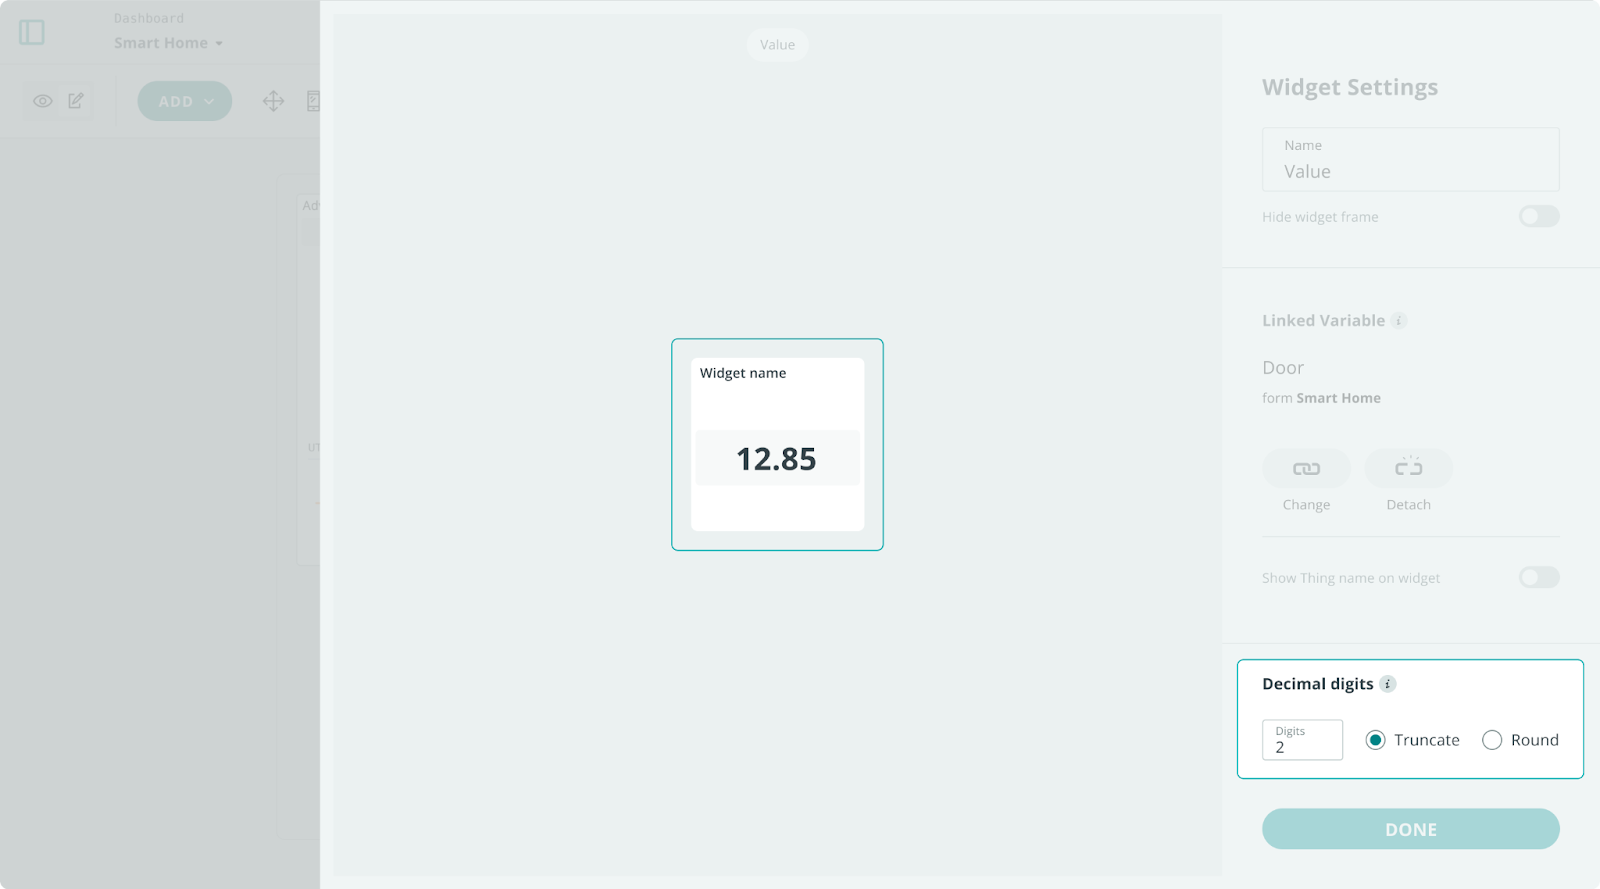
2. Customize your IoT Value Widget
Customizing widgets has been a common request from our user community, and we’ve recently addressed this with the introduction of decimal settings in the “Value” widget. This much-awaited feature allows users to configure the number of decimal digits displayed in the widget when dealing with floating-point variable types.
When selecting a floating-point variable type, users can specify the decimal precision shown in the widget and choose whether to truncate or round the value. Importantly, this setting only affects the visualization, not the actual variable value.
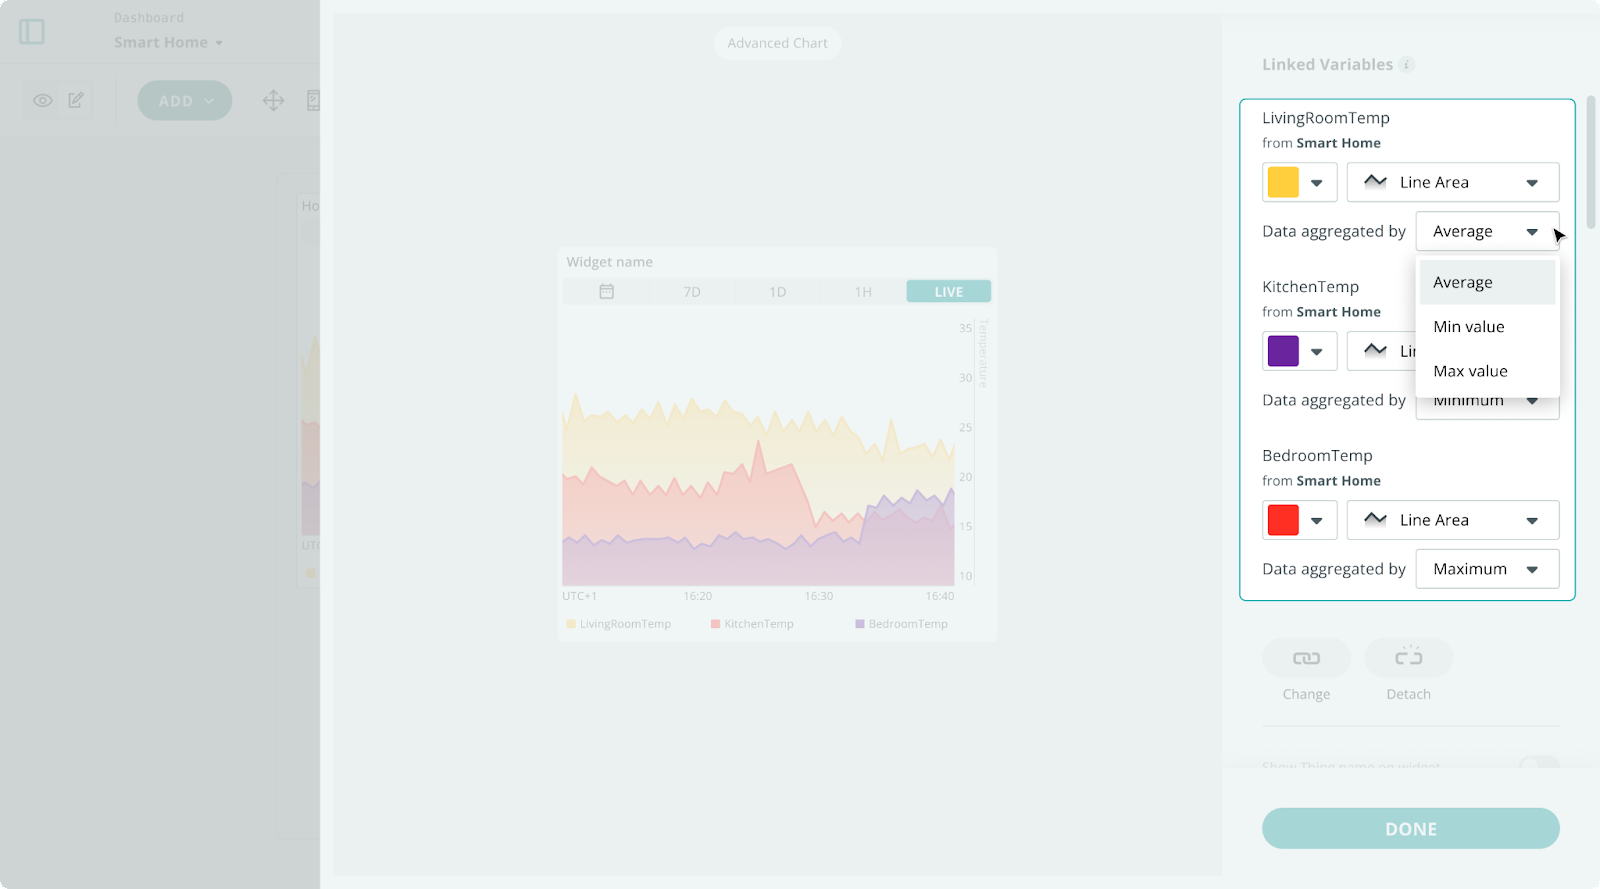
3. Enjoy the new data aggregation method in Advanced Chart widget
Advanced chart widgets are one of the most popular widgets for data analysis as they help you improve your data analysis. The widget now includes support for configuring the data aggregation method.
But what does it mean?
The chart widgets come with a smart implicit feature known as data aggregation. To prevent the chart from becoming too messy with an excess of data points, there is a fixed limit of data points per chart:
If the number of data points to show is lower than the maximum number of data points, there is no aggregation.
If the number of data points to show is bigger than the maximum number of data points, data is aggregated.
Before this update, there was only an implicit aggregation method, which was the average.
With this new Advanced Chart widget feature, you can now choose the aggregation method that suits your needs. Options include average, max value, and min value:
Average: Calculates the average of the data for each aggregation period.
Max value: Uses the maximum value within the aggregation period.
Min value: Uses the minimum value within the aggregation period.
This enhancement is a direct result of the feedback from our community. It’s a feature that has long been requested by users, and we’re happy to finally deliver it.
4. Deploy ready-to-use dashboards and firmware for your ESP32 devices
Templates are one of the most popular features of the Arduino Cloud. You can select a ready-to-use solution and deploy it with one click. You get the software and an IoT monitoring dashboard. If you need to do modifications for your IoT project, you can just edit the code and dashboard and off you go! It’s a fun and easy way to get started.
The exciting thing is that two new dashboard templates for ESP32 boards are now available, complementing the offering for Arduino boards:
As a bonus, we’re also introducing a handy new feature – now when you add a widget to a dashboard, you’ll see a preview and description of the widget. This makes it even easier to choose the right widget for your dashboard and streamline your project setup process.
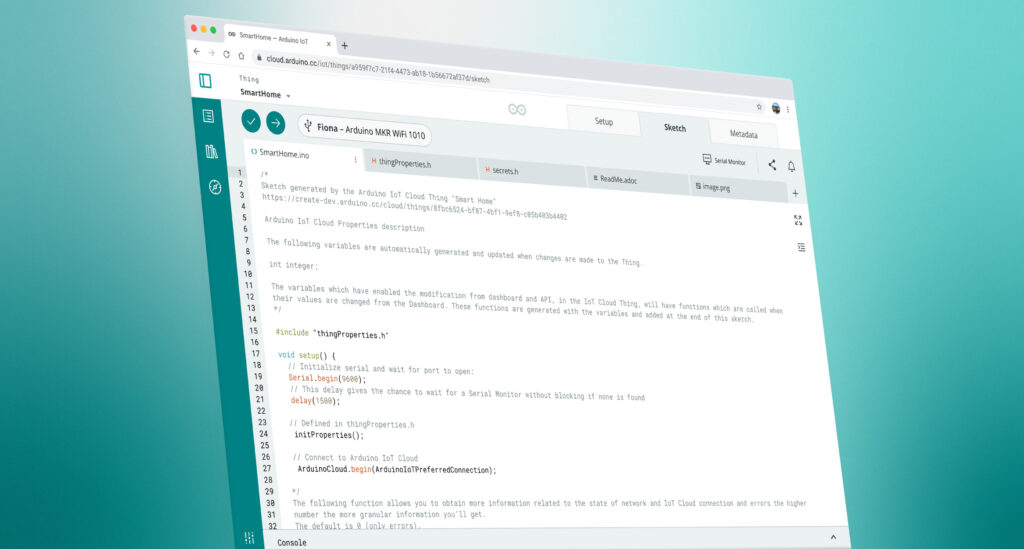
Welcome to the next chapter in our ‘Better, with You’ journey! In recent blog posts, we’ve explored the refreshed look of Arduino Cloud and introduced the latest features of the renewed Arduino IoT Remote app. Today, we’re thrilled to unveil another game-changer, the new Arduino Cloud Editor, which brings the classic Arduino IDE experience to your browser.
The new Cloud Editor
Imagine that you can start your project without having to deal with any annoying setups or maintenance headaches. Imagine that you’re free to work from wherever you want. Well, that’s the vibe of our new Cloud Editor. We’ve made the whole development experience way smoother, so you can forget about the boring techy stuff and just focus on bringing your ideas to life. Let’s dive in!
A unified and more powerful editor
Traditionally, Arduino Cloud had two separate editors: an embedded simple one and the full editor. Users have long awaited a unified editor that gets the best of each one. The new Cloud Editor achieves just that, completely revamping its implementation and setting the stage for exciting new upcoming features.
Tip: To facilitate a smooth transition, the new Cloud Editor will coexist with the current one over the next 2 months. During this period, you can choose to opt-in for the new editor or keep the existing version. It’s your call! Scroll down to the “Try it now” section to find out how to activate the new Cloud Editor on your account.
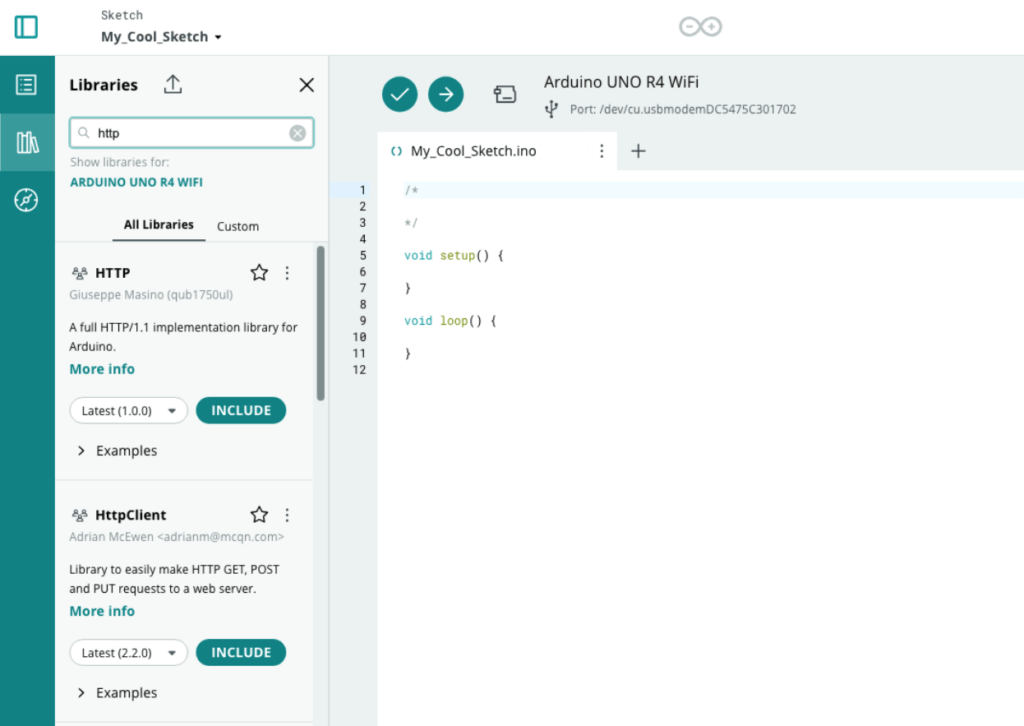
Better library and example management
The new Cloud Editor provides a library manager that helps you explore and organize libraries as well as easily use their examples.
Screenshot of the revamped library manager in the new Arduino Cloud Editor
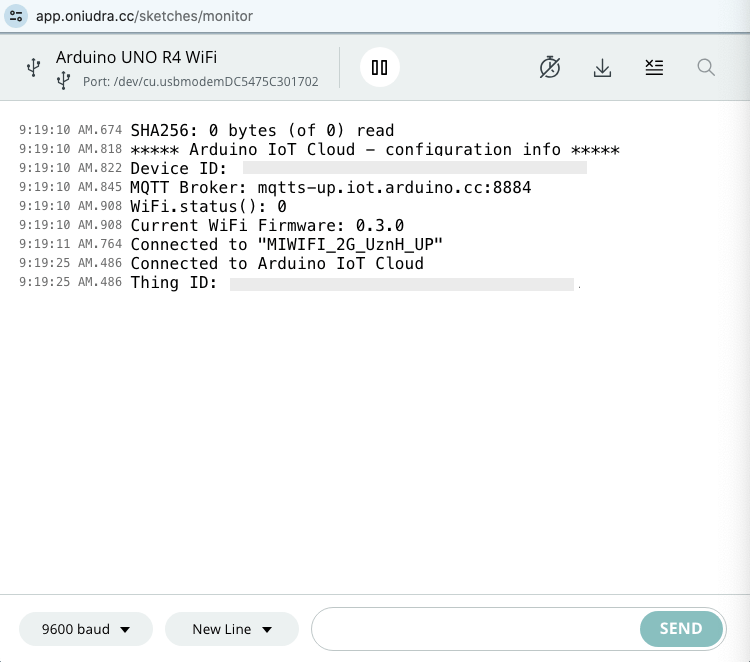
Improved serial monitor
The serial monitor has been improved with the ability to download logs and the inclusion of timestamps per line. This is a long-time requested feature by users to improve debugging.
Screenshot of the improved serial monitor with timestamps in the new Arduino Cloud Editor
Support for any Arduino IDE-compatible device
The Arduino Cloud Editor supports any device compatible with the Arduino IDE, thus extending your Arduino development experience to your browser.
A single sketch repository
Whether you’re programming IoT sketches or traditional ones, the new Arduino Cloud provides a unified place to store and organize your sketches with a single editor for all of them.
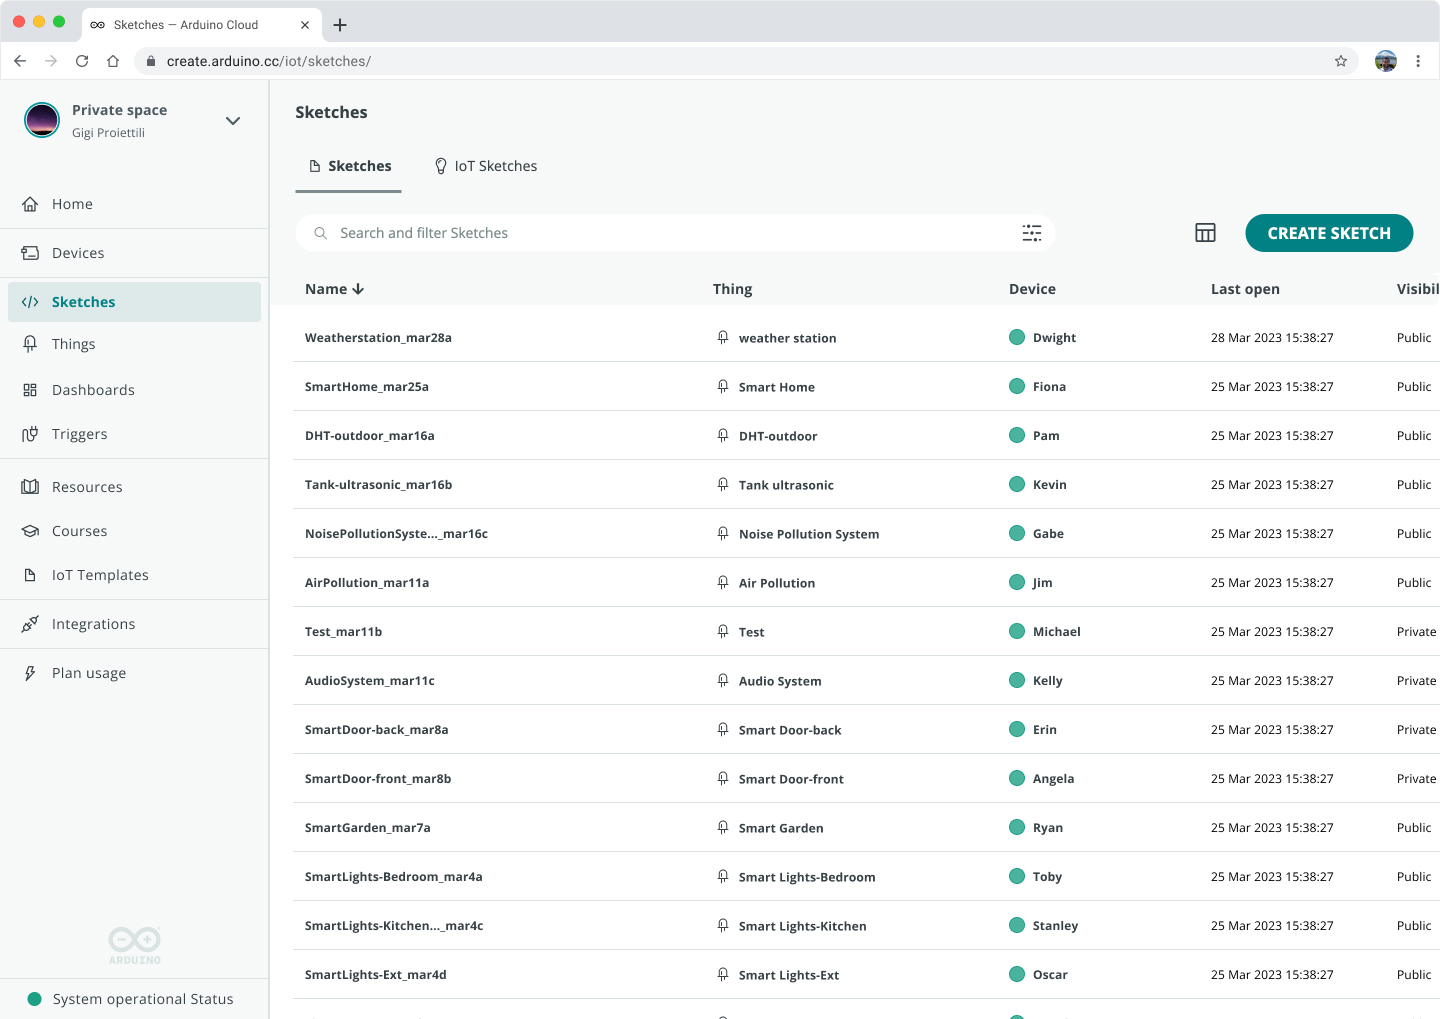
Screenshot of the new Arduino Cloud sketchbook with the Sketches and IoT Sketches tabs
Keep your sketches organized
The sketchbook allows you to create folders so that you can keep your sketches organized in a more efficient way.
How to use the Cloud Editor
In the new Arduino Cloud, sketches are organized as “Sketches” and “IoT Sketches”, where “IoT Sketches” are the ones that have been created to connect the application with Arduino Cloud so that it can be monitored and controlled using the dashboards.
Your standalone sketch development starts from the “Sketch” section of your sketchbook. Just click on “CREATE SKETCH” or select the sketch you want to edit.
IoT Sketches are automatically created when you create an Arduino Cloud Thing. Once they are created, you can access the sketch either from the Thing or the “IoT Sketch” section of your sketchbook.
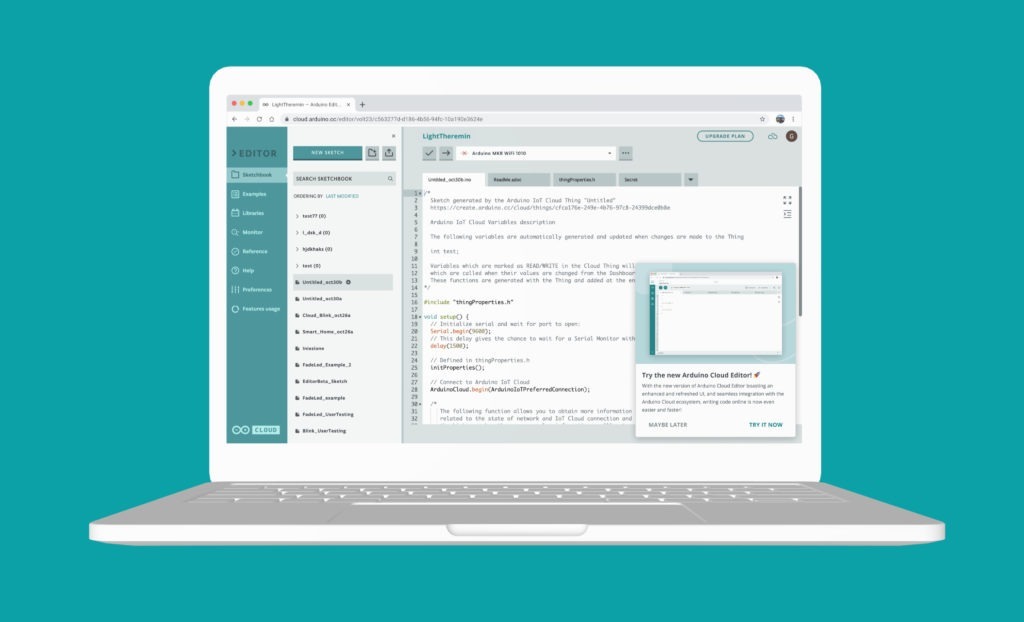
Try it now
Click on “TRY NOW” as shown in the screenshot below to start using the new Cloud Editor. If you need a bit more time before moving to the new version, you can still use the existing version until March 31st by clicking on “MAYBE LATER.”
You can now have the option to try the new Cloud Editor from the notification at the bottom right hand corner of your screen.
Please note that Chromebook support will not be available initially. Stay tuned for updates as we will announce Chromebook support as soon as it is ready.
The new editor is part of the new Arduino Cloud
If you’re just getting into the Arduino Cloud, don’t worry, we’ve got the lowdown for you right here. Arduino Cloud is the next exciting step in the Arduino journey for IoT enthusiasts. Here is a quick intro video that will give you a summary in 2 minutes.
Basically, if you’ve got an IoT project idea, you can easily turn it into a real project using this all-in-one, easy Cloud platform. It helps you create applications that can be monitored and controlled from custom dashboards accessible from your browser or your mobile phone. It not only supports Arduino and ESP-based devices, but also any device programmed using Python, MicroPython, Javascript or Node-RED. Which is why the Arduino community is talking a lot about it at the moment! Forget about dealing with complicated stuff – the Arduino Cloud lets anyone, no matter their skill level, create stuff from wherever.
Want a sneak peek? Here’s Karl giving you a tour of Arduino Cloud with the latest new UI.
Get started with the Arduino Cloud
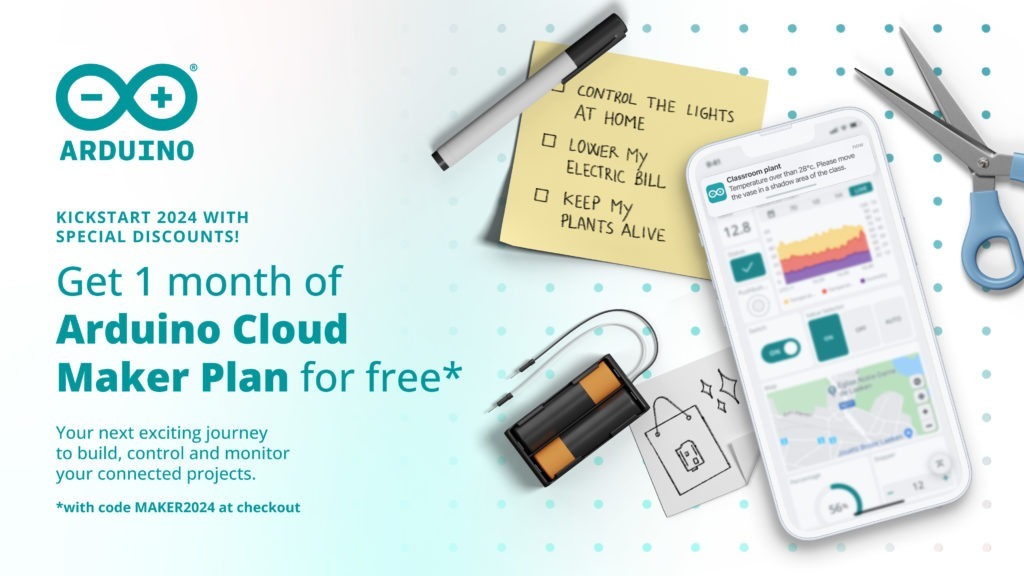
Are you ready to dive in? Learn more about the new Cloud Editor through our detailed documentation. And to sweeten the deal, don’t forget to grab your first month free on the Maker plan with the code ‘MAKER2024 at checkout. But hurry, this offer is only valid until January 31st (You can cancel anytime). Join us in unlocking the full potential of your creative projects!
Welcome to the next chapter of our ‘Better, with You’ journey! Now it is time to present the latest updates to the IoT Remote app. These new features are all about making your time with your IoT projects smoother, more fun and right at your fingertips. Let’s dive in!
If you haven’t caught up on our journey so far, make sure to check out our first blog post of the series, where we reveal a brand new UI on the Arduino Cloud.
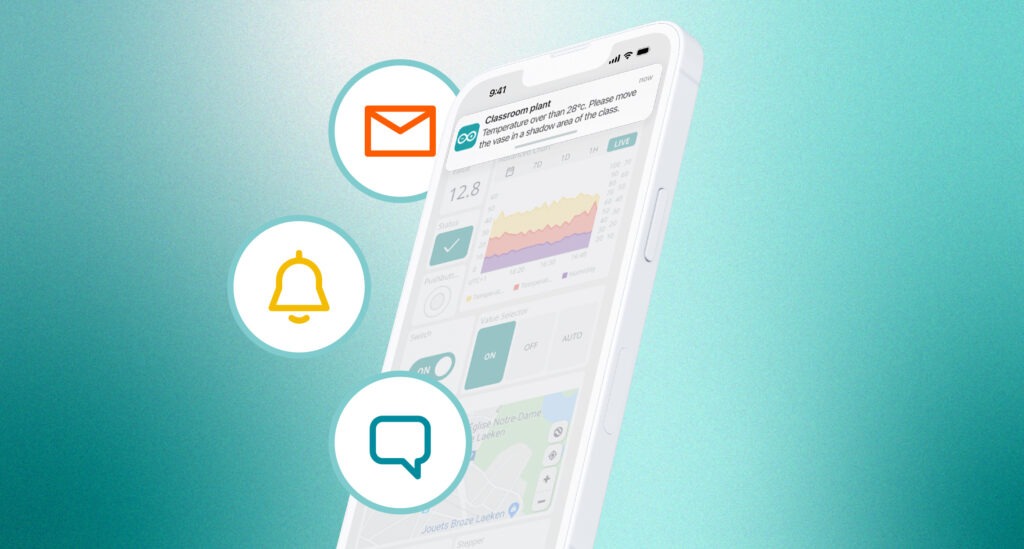
Push notifications for real-time alerts
As your list of projects grows and time becomes a rare commodity, checking the status of all your projects on a regular basis is nearly impossible. That’s why having a heads-up for anything significant happening in your deployments is an absolute game-changer. A few months ago, we introduced Triggers and Notifications, a feature that allows you to configure conditions in the Arduino Cloud that trigger email notifications.
Now, with the new IoT Remote app version, you can customize and receive alerts directly on your mobile device. Because we know how life can sometimes get crazy and convenient it is to get notified directly on your phone.
Remember, to unlock this feature, you’ll need the Maker plan ($5.99/month). Make sure you upgrade your plan to use it.
How to use the notifications in your phone
The process is quite straightforward:
Configure your Triggers and Notifications in the Arduino Cloud
Enable notifications in the IoT Remote app
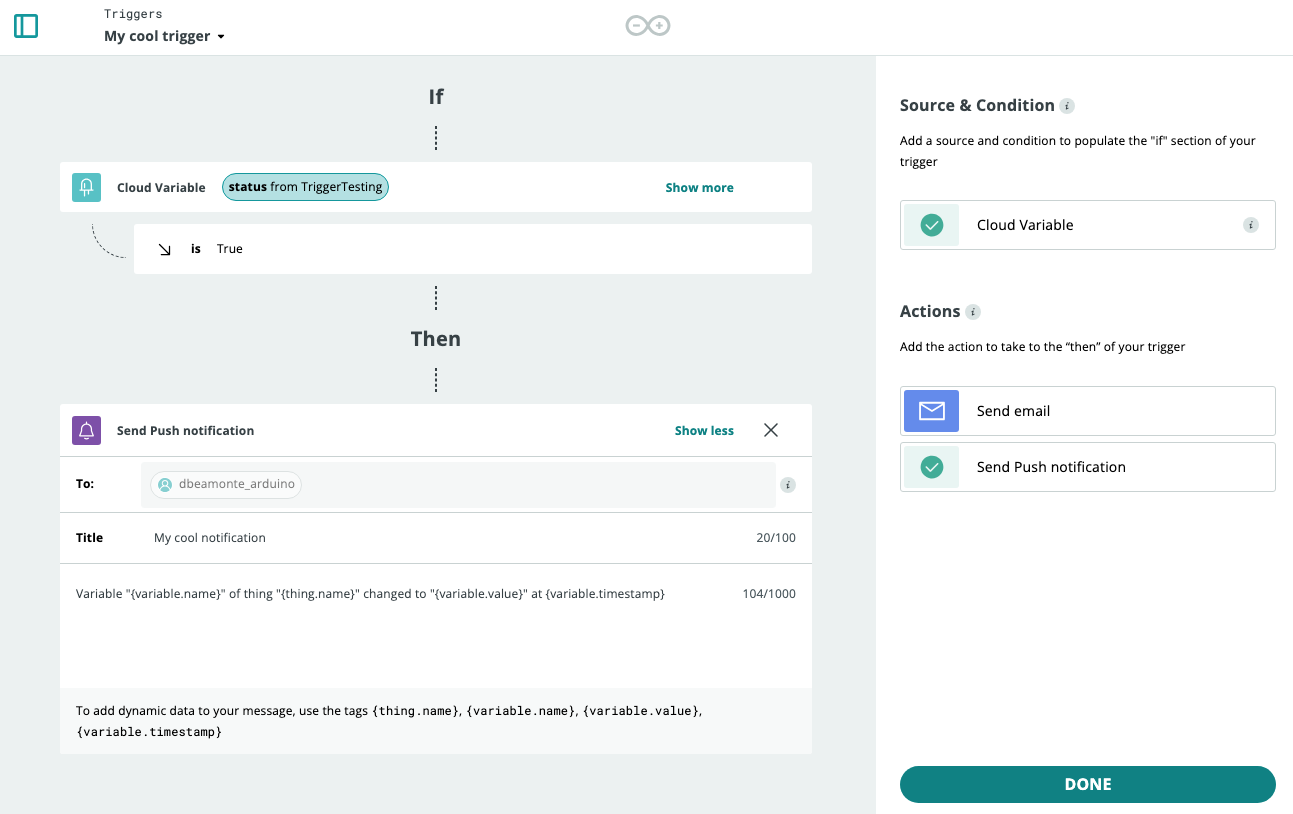
Configure your Triggers and Notifications in the Arduino Cloud
Click on CREATE TRIGGER to start the creation of the Trigger.
Configure your condition selecting your variable.
Configure your desired action: In this case select “Send Push Notification.” Note that you can additionally configure email notifications as well for the same trigger.
Define the fields of your notification: Title and Body.
Triggers set up process in Arduino Cloud
And that’s it. You are ready to configure notifications on your mobile phone.
Enable notifications on the mobile phone
When you open the app with the new version for the first time, you are prompted to allow the app to send you notifications. If you accept, you are ready to go and you will receive instant alerts.
You can change your settings at any time in the “Manage push notifications” menu to enable or disable the notifications behavior.
Learn more about the full configuration process in the documentation article.
Improved app UI
Activity monitor
Explore the history of your project’s alerts with the Activity tab. It is the ideal companion to push notifications, providing you with a comprehensive overview of your notifications activity.
Activity tab in the Arduino IoT remote app
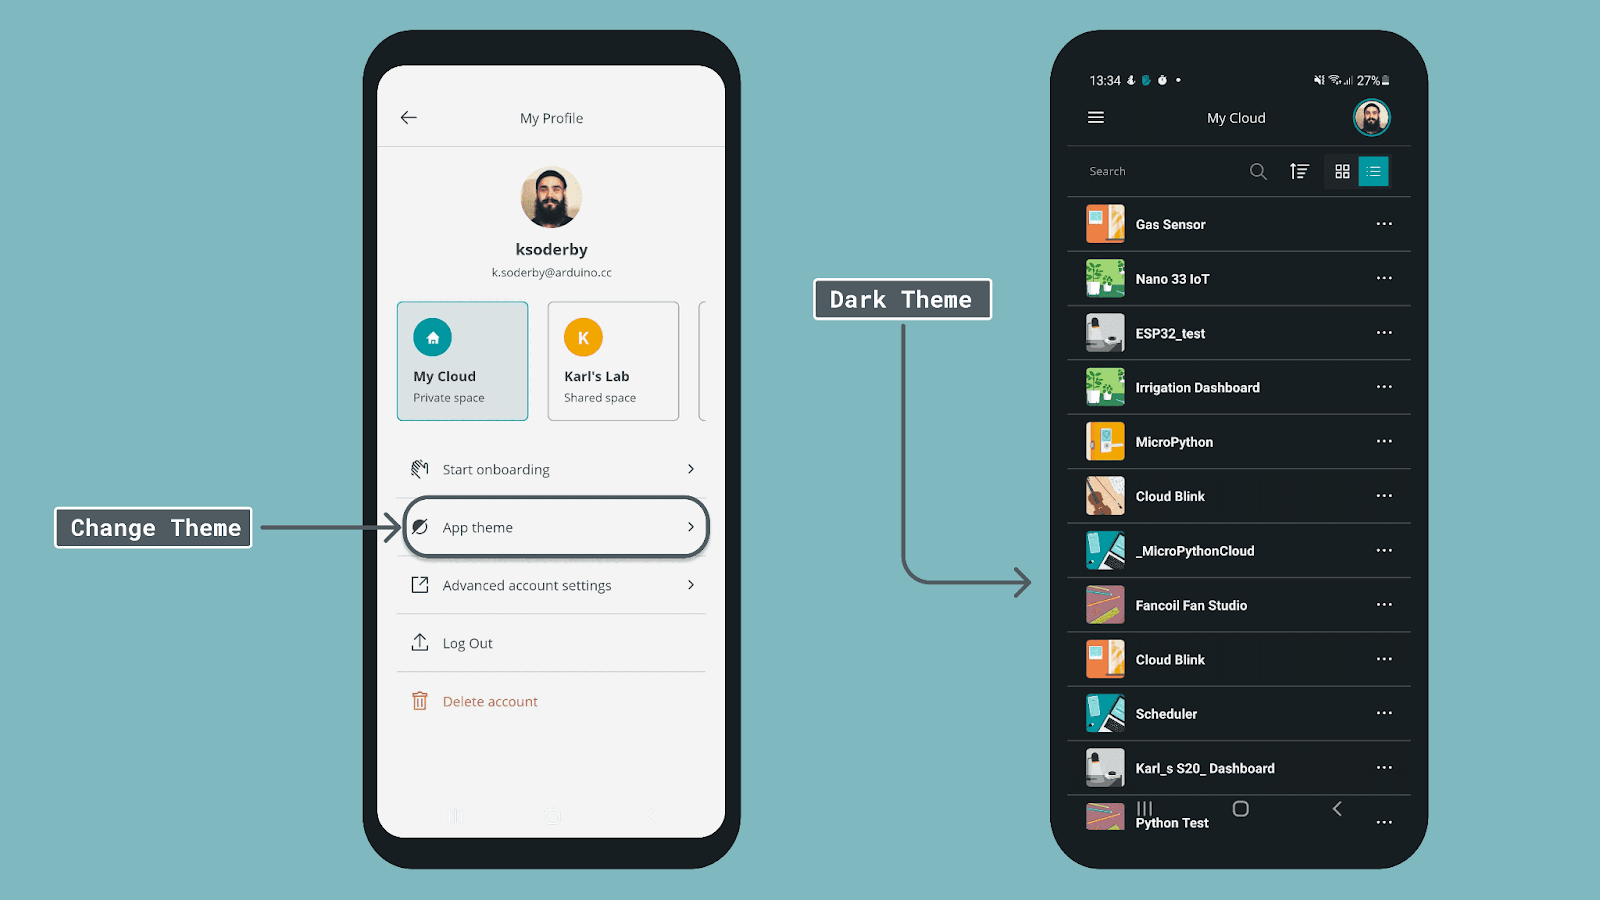
Dark mode
Finally, the long-awaited Dark Mode is here! You can now experience a more comfortable and elegant interface by simply enabling Dark Mode in the IoT Remote app. For a quick guide, refer to the documentation article.
Change theme (light/dark)
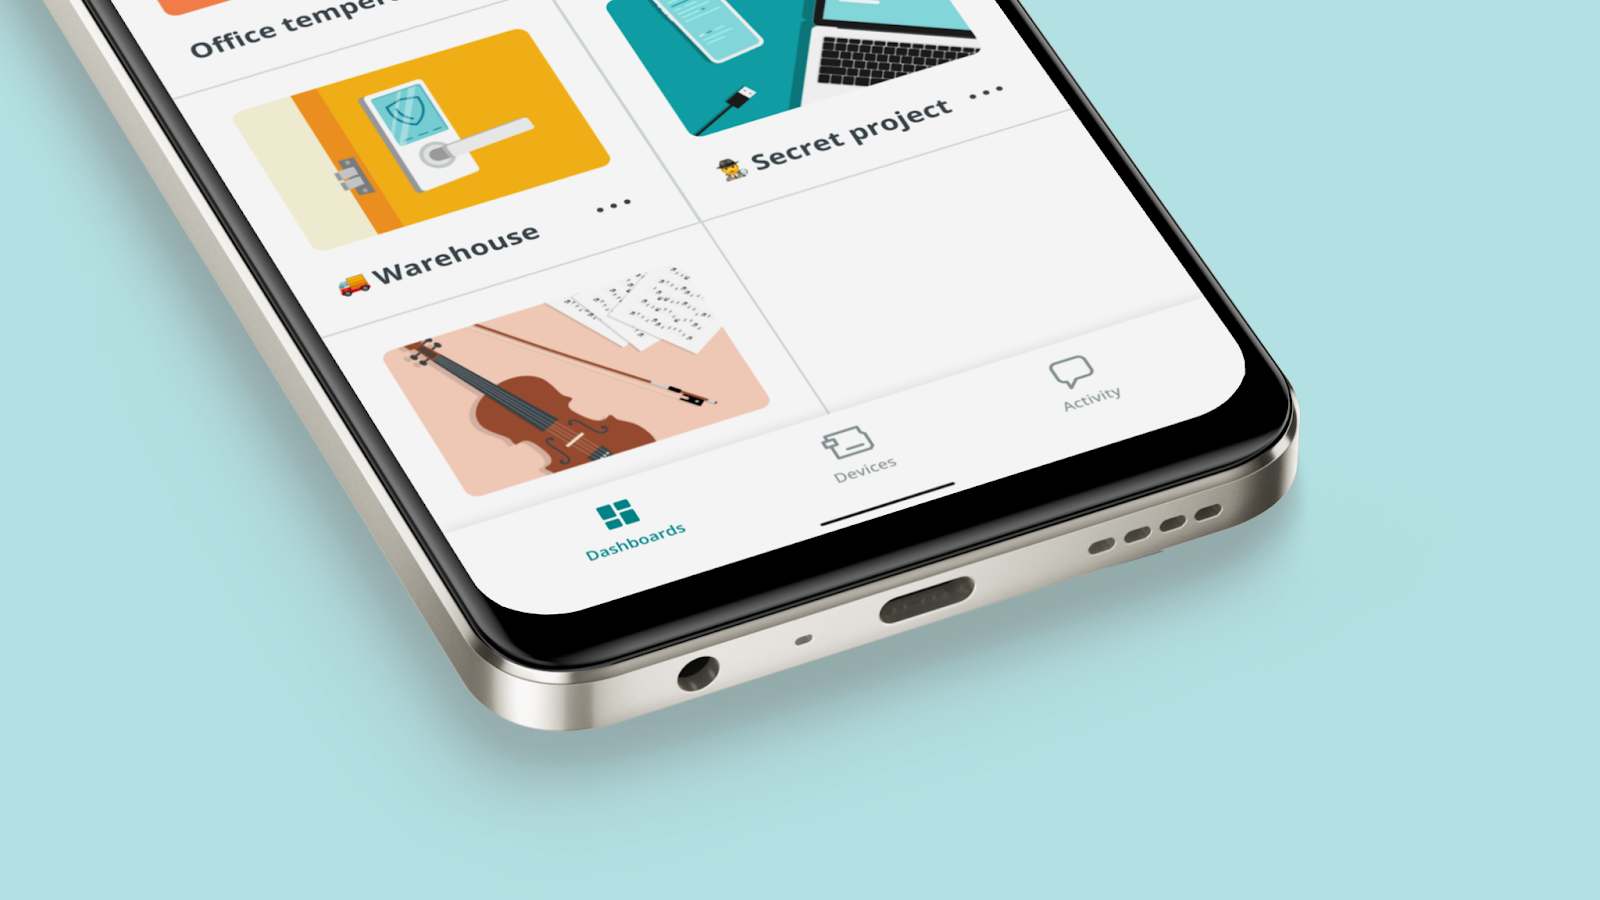
New bottom navigation bar
The new bottom tab bar enhances your user experience simplifying the app navigation. This update is part of the major UX improvements implemented on the Cloud. You can seamlessly switch between sections and enjoy a more intuitive journey within the app.
New UI with enhanced navigation bar in the Arduino IoT Remote app
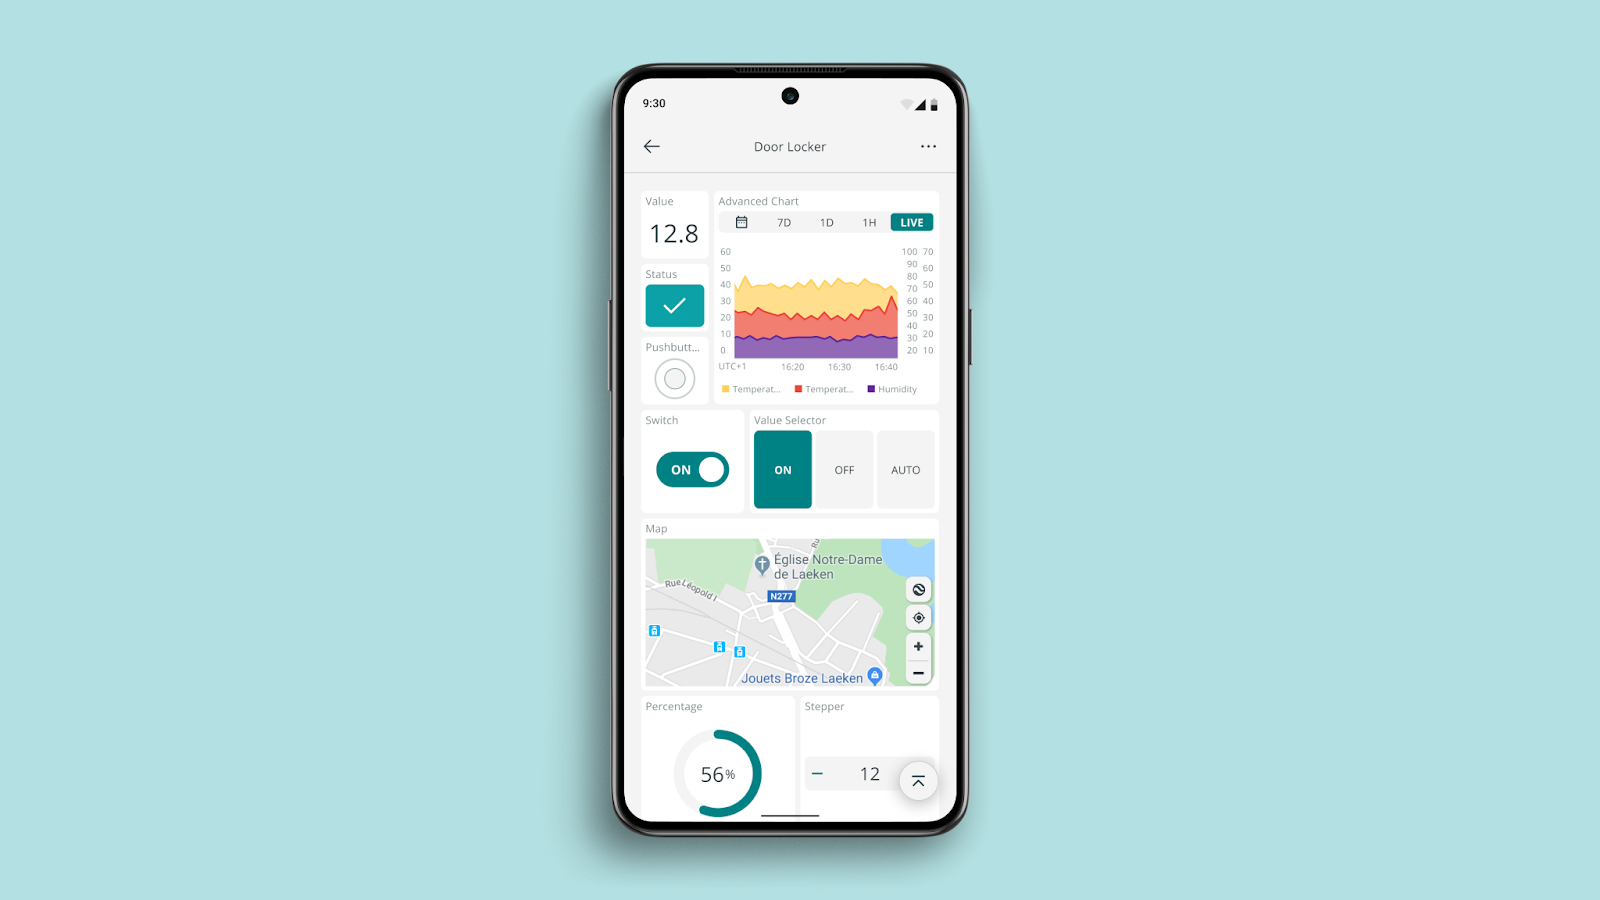
Redesigned widgets
Widgets have been redesigned to provide a clearer and refined data visualization. These improvements are also part of the major UX enhancements implemented on the Cloud.
Enhanced widgets in the Arduino IoT Remote app
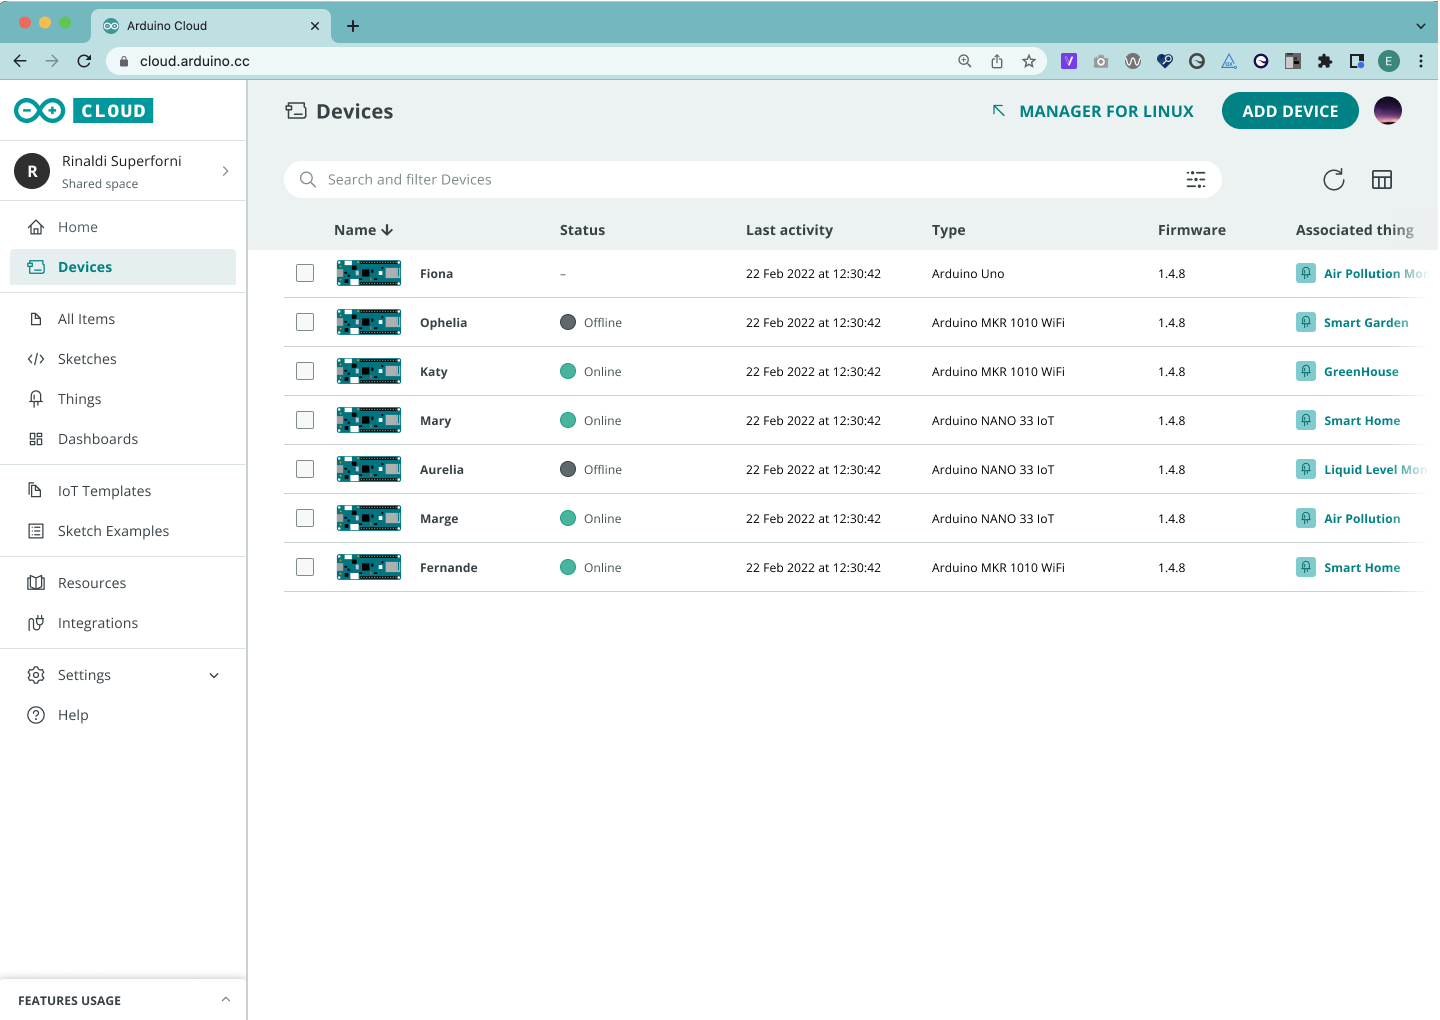
Devices list
We understand the importance of simplifying device monitoring. Check the status of your devices and their associated things directly from the IoT Remote app. It’s about bringing convenience to your fingertips, contributing to better IoT project management.
What is Arduino Cloud?
In case you’re new to this whole concept of the Arduino Cloud, we didn’t want to miss the opportunity to remind you of it here. The Arduino Cloud is the next exciting journey for IoT enthusiasts to bring their projects to life quickly. It is an all-in-one intuitive IoT platform, supporting a wide range of hardware and backed by the vibrant Arduino community. The Arduino Cloud removes complexity to empower users from all levels of expertise to create from anywhere, and control and share their projects with amazing dashboards that can be accessible with the IoT Remote app.
The following video provides a comprehensive quick tour of the new UI.
Download the IoT Remote app
Ready to try alerts in your phone and explore the new look and feel? Learn more about the new IoT Remote app features, download the IoT Remote app (available for Android and iOS), and create a new account to get started with the Arduino Cloud.
And stay tuned for more news. We are creating a better cloud, with you!
At Arduino, we’ve always believed in the power of community. Our journey has been shaped by the incredible feedback and input we’ve received from our users, and today, we’re thrilled to introduce a renewed and improved Arduino Cloud based on your insights.
This renewal goes beyond just a fresh coat of paint. It impacts not only the new user interface (UI) but also many other aspects of the Cloud, as well as our IoT Remote app. These new features and improvements will be progressively introduced in the coming weeks, so be sure to stay tuned for the next wave of exciting announcements.
It’s better, with you
Arduino Cloud is the platform that Internet of Things (IoT) and do-it-yourself (DIY) enthusiasts use to develop, monitor, and control their creations. It is an increasingly popular platform that was born to democratize the access to IoT, to make it simple and accessible for everyone, pretty much in a similar fashion as Arduino has done with hardware and DIY. Our journey mirrors our core values: open-source, accessibility, and community-driven innovation.
And it’s your contributions that drive our progress. Through our thriving forum, direct feedback channels, and our shared community-driven values, we actively engage with your ideas, questions, and experiences to shape the future of the Arduino Cloud. Your input is invaluable in our quest to create a platform that truly meets your needs and aspirations.
We’ve listened, we’ve learned, and we’ve transformed. The result is a platform that’s more intuitive, powerful, and user-friendly than ever before. It’s better, with you!
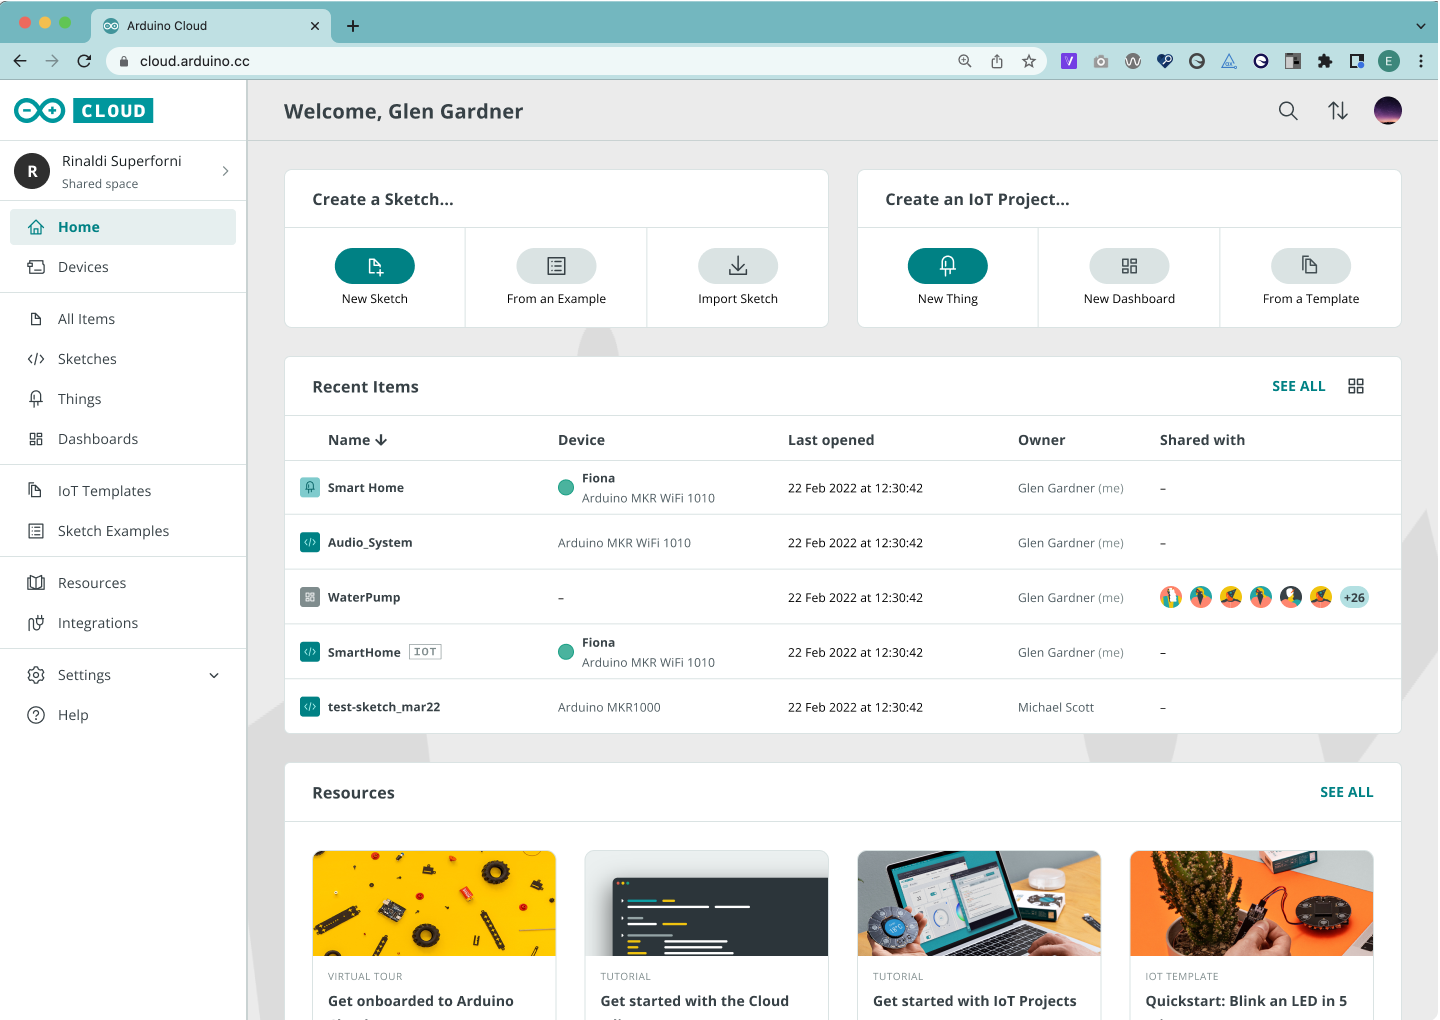
New user interface
The first major feature we’re excited to unveil is the brand-new user interface (UI). The UI has been designed with your needs in mind, and we’re confident it will greatly enhance your interaction with the Arduino Cloud.
What’s new in the UI?
New navigation bar: Say hello to a new, sleek navigation bar in the Arduino Cloud. You can now seamlessly jump between your devices, sketches and your dashboards.
Cleaner design: We’ve revamped the design to make it more visually appealing and clutter-free. Your projects and data take center stage, ensuring a distraction-free development environment.
New sketchbook: Discover a new evolution of our sketch management features, turning your sketches into a digital, secure sketchbook. You’ll always be on top of things, whether you’re tinkering with IoT projects, working on standalone sketches, or both.
Quick access to templates: We’ve made it easier for users to find and select pre-built templates from the new navigation bar. Now, you can choose among thermostat control, ventilation, smart garden, and many more to get quickly started with an IoT project.
Shared Spaces home dashboard: We’re introducing a new dashboard view for Shared Spaces, where you can monitor usage of the Cloud instantly.
White labeling: With our new white labeling feature, you can add a custom logo to your dashboard and even customize the Arduino logo on the top left. Make it truly yours!
What’s on the horizon
But this is just the beginning. Over the next few weeks, we have a series of major announcements lined up. Without giving away all the surprises, we can promise you more exciting features and enhancements to make your development experience even easier and your IoT projects even more accessible. Keep an eye out for upcoming blog posts where we’ll reveal these exciting developments.
Try Arduino Cloud today
At Arduino, we’re committed to improving our products and services with your active participation. The renewal of the Arduino Cloud is a testament to the power of community-driven innovation.
We invite you to explore the new UI, experiment with the features, and share your thoughts with us. Your feedback is invaluable as we continue to enhance the Arduino Cloud. Share your feedback, ideas, and experiences with us on social media, forums, and other communication channels.
Thank you for being a part of the Arduino community and making Arduino Cloud better, with you.
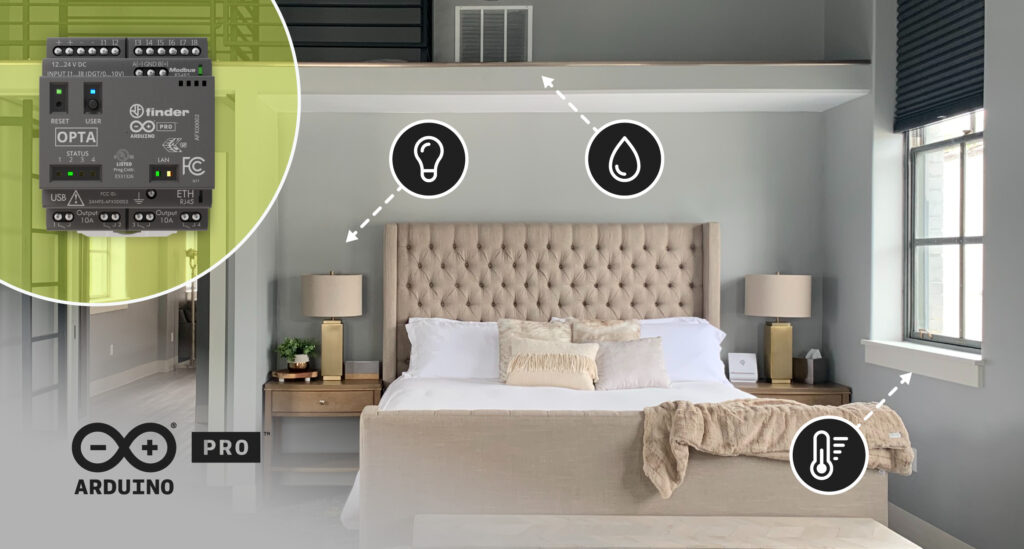
Hospitality professionals are constantly looking for ways to offer guests an enhanced experience while improving operational efficiency and optimizing energy management. To achieve this, they require cost-effective solutions that are easy to install and maintain while also providing the scalability of future-ready systems – such as automating hotel rooms or B&B rentals to increase safety, comfort, and energy savings.
Indeed, automation can be integrated seamlessly in various aspects including climate control, lighting, security, and entertainment. Upgrading these functions allows guests to enjoy customization and convenience throughout their stay, and staff to efficiently manage room settings remotely. Moreover, hoteliers can achieve substantial energy savings through optimized control and scheduling, contributing to sustainability goals.
Long-term scalability and future-proofing of automation systems, however, can be an issue. As hotels and rental properties undergo renovations or expansions, the ideal solution should accommodate changes without requiring substantial modifications or replacements. Adopting open and standardized protocols, as well as selecting flexible and modular automation projects, can help mitigate these challenges and provide a foundation for future enhancements.
Our solution
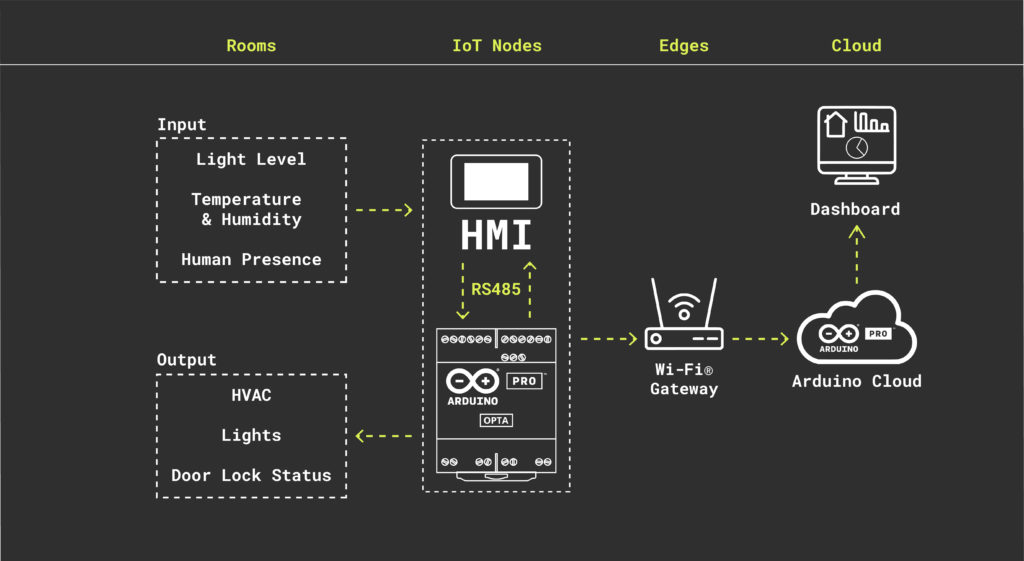
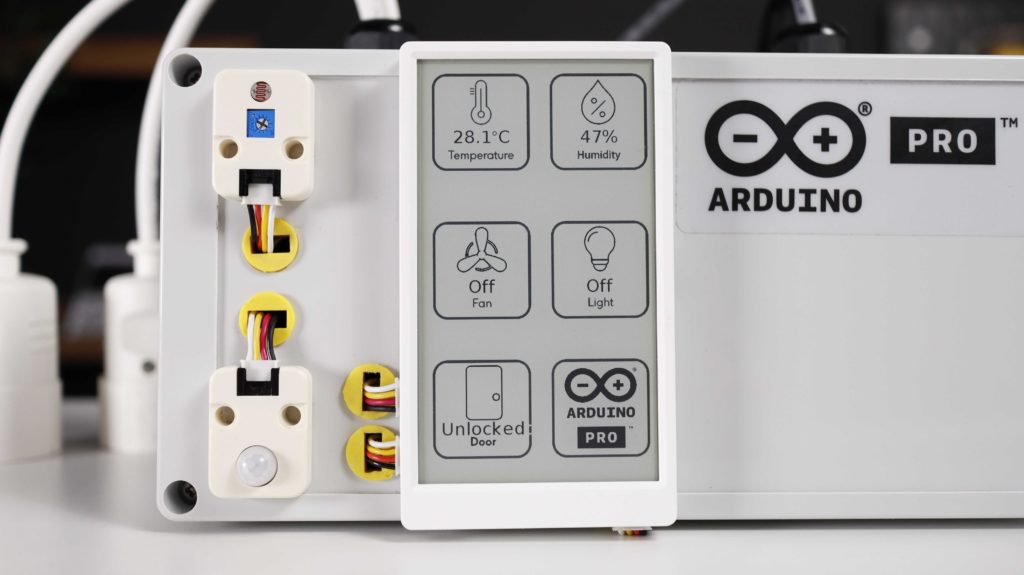
A comprehensive IoT automation solution can address these challenges effectively by aggregating sensor and user data and then intelligently managing lighting, cooling/heating and more – for a smart, connected experience. The elements required to achieve this kind of outcome are environmental sensors, a programmable logic controller (PLC), a human-machine interface (HMI), and cloud connectivity.
Programmable logic controller (PLC)
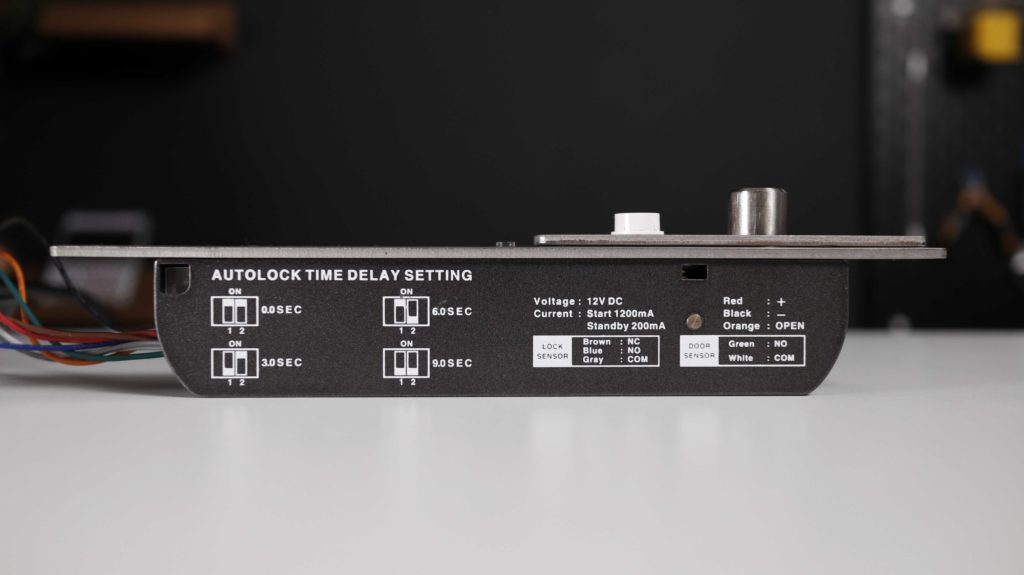
PLC-based automation systems are widely used due to their reliability, flexibility, and ability to handle complex tasks. Arduino Pro’s Opta microPLC can serve as the central control unit for hotel room automation by connecting and monitoring various devices and subsystems such as HVAC (heating, ventilation, and air conditioning), lighting and door locks. The microPLC receives data from sensors and users and processes them to trigger appropriate actions or adjustments in the room.
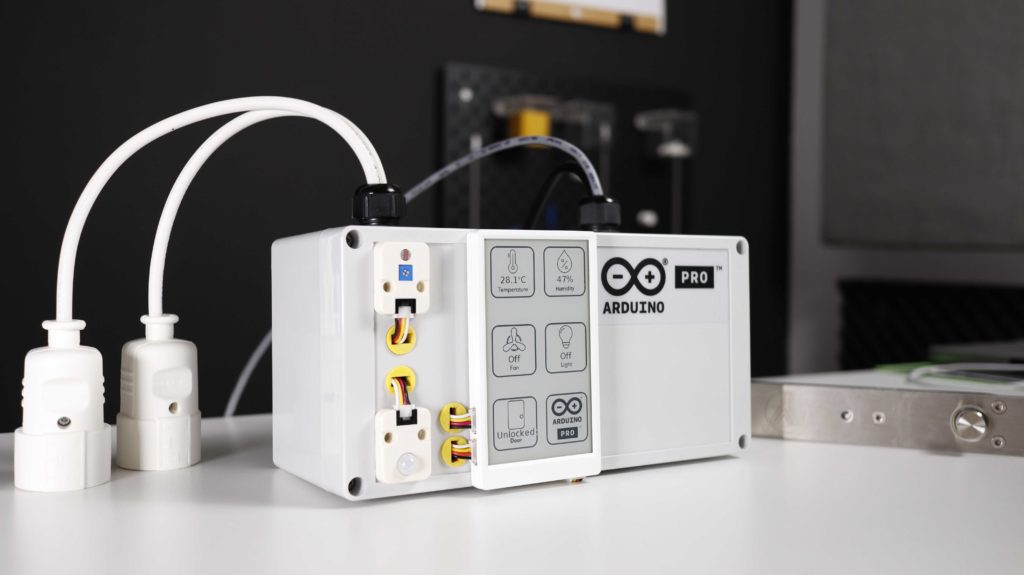
Human-machine interface (HMI)
A touchscreen panel through which guests and staff can control various room parameters – such as lighting status, fan status, and door lock status – provides a user-friendly and intuitive interface to interact with the automation system. This HMI also communicates data to the microPLC for execution.
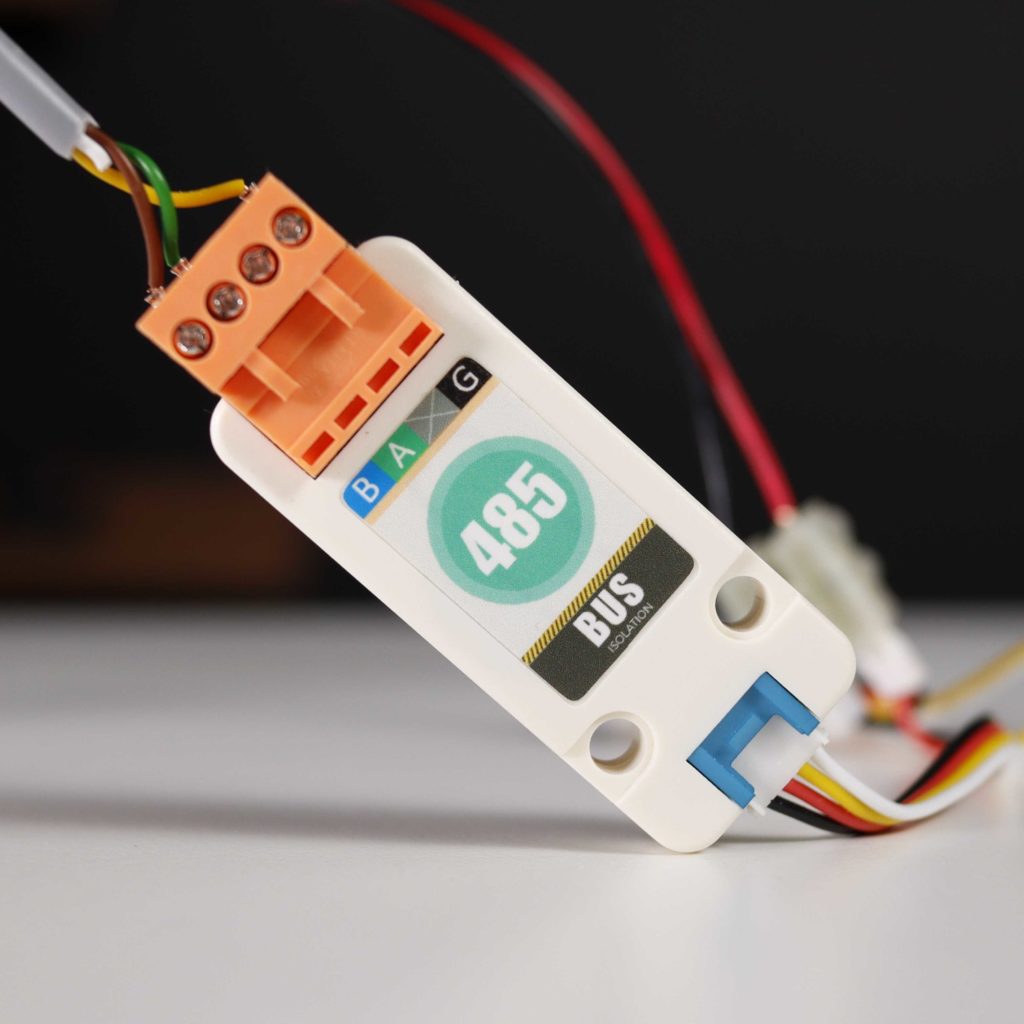
The Modbus communication protocol
The HMI and Opta PLC communicate via Modbus RTU over RS-485. Modbus RTU communication protocol is widely adopted in industrial applications due to its reliability, provided by the physical layer strength and by the cyclic redundancy check included in the data packets. It allows for multiple devices to be connected to the same bus, forming a multidrop network where each device has a unique address, used to identify the recipient of the transmitted data. The Arduino Opta can communicate with other Modbus devices, such as sensors, actuators, or traditional PLCs, by addressing them individually.
IoT Cloud solution
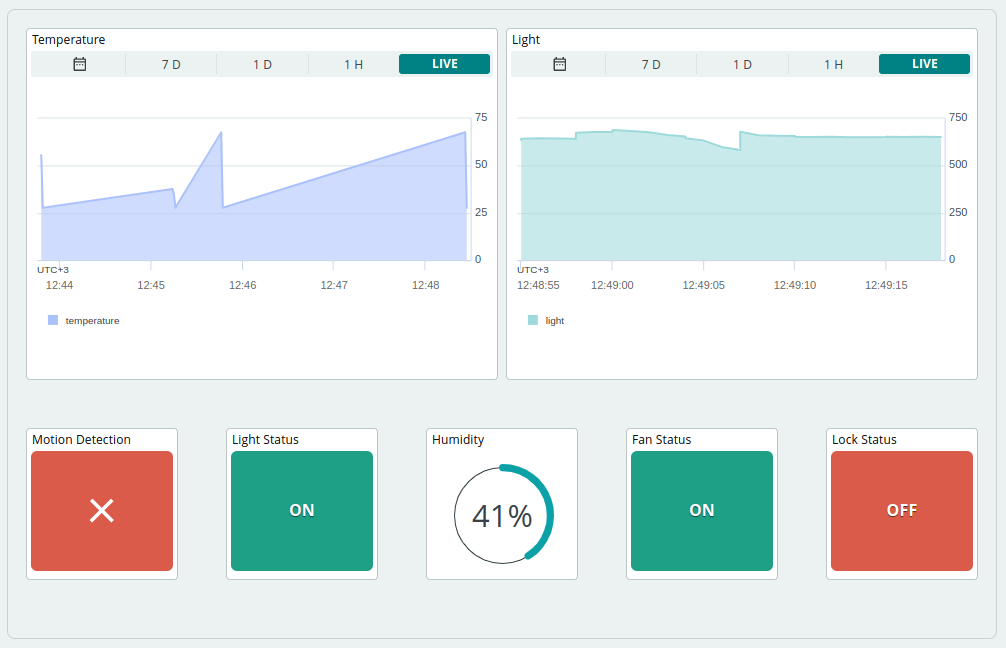
Cloud connectivity enables seamless communication between the hotel room or rental property’s automation system and the central management system. The Opta and HMI connect to the cloud infrastructure, allowing remote access, monitoring, and control of multiple locations. The solution also enables data logging and analytics for better energy management, predictive maintenance, and guest experience personalization.
Solving it with Arduino Pro
Let’s get into the details of how this solution can be put into action, and identify the hardware and software resources needed for deployment. Arduino Opta is a great option for deploying building automation solutions, as it offers simple integration with current systems, real-time control capabilities, support for Over-The-Air (OTA) firmware updates, and Hardware-To-Cloud data security. The Arduino Pro ecosystem allows users to benefit from easy integration, along with a range of scalable, secure, and professionally supported services.
The Arduino IDE 2.0 can be used to program Opta using C/C++. Opta acts as the main controller, communicating with the HMI via the Modbus RTU protocol. The HMI gathers data from various sensors – including light, temperature and humidity, and PIR (movement sensor) – as well as user inputs from its interface buttons related to room climate, lights, and door lock status. It then forwards this data to Opta, which controls the relay outputs that will activate the lights, thermostat or door lock.
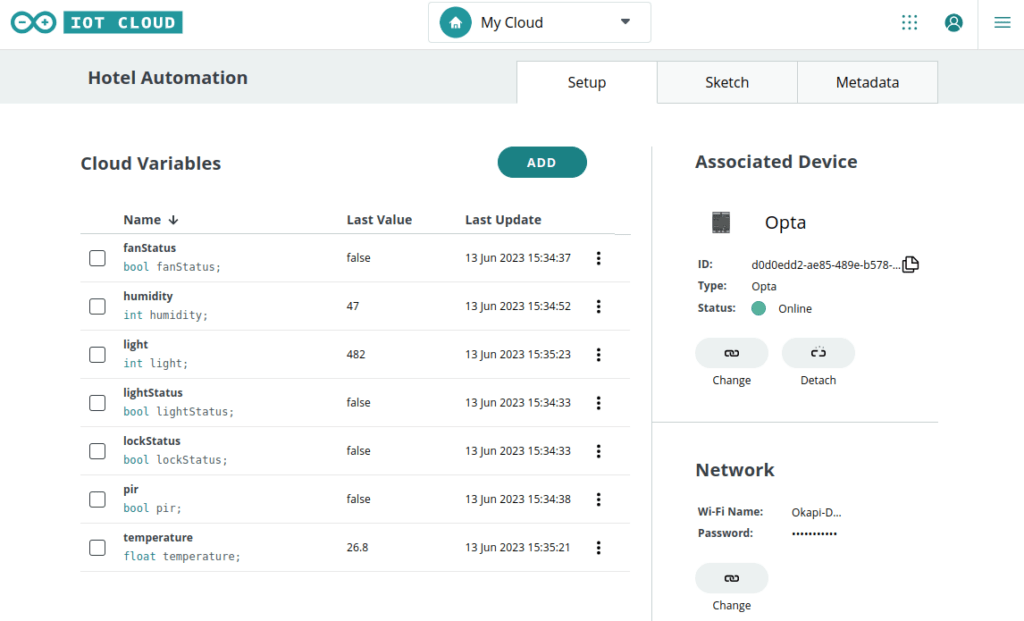
Opta also sends this data via Wi-Fi® to the Arduino IoT Cloud. After connecting it to the Arduino Cloud using the Arduino Create Agent, cloud variables corresponding to the sensor data being monitored can be defined.
Arduino Pro’s Opta microPLC offers an ideal solution for the automation of hotel rooms and B&Bs or rental properties. By leveraging standard communication protocols, easy integration, real-time control capabilities, secure hardware-to-cloud data exchange and remote access to multiple rooms from a centralized location, Opta provides the cornerstone of a comprehensive platform for smart hospitality.
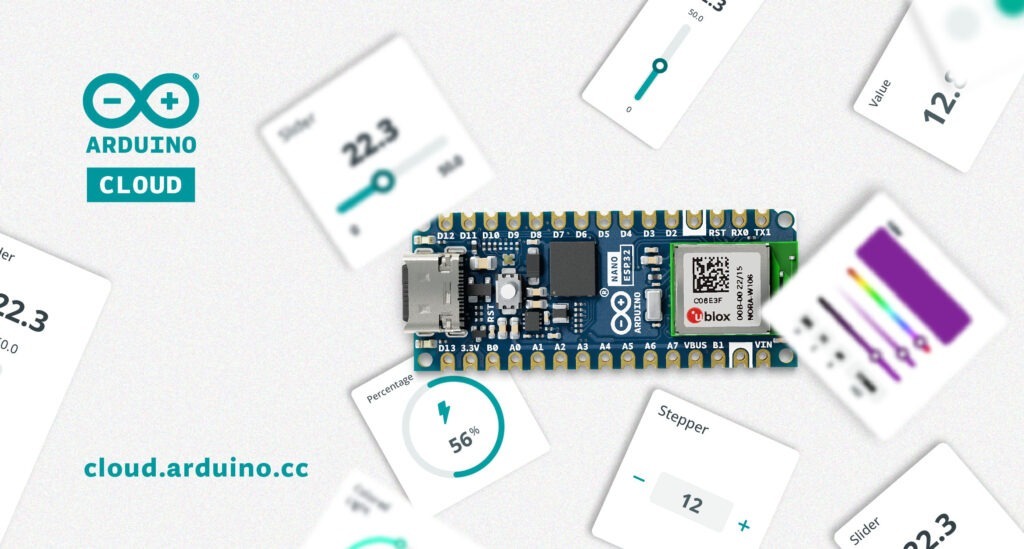
For users delving into the exciting world of DIY IoT, one common challenge that they frequently find is how to effectively visualize the data generated by their custom-made devices using mobile apps or web browsers. These devices, often built around Arduino or ESP boards, empower makers to craft innovative solutions for a wide range of applications. However, the missing piece of the puzzle is to find a simple, straightforward and reliable way to visualize and interact with the sensor data.
Imagine that your device is controlling humidity with an ESP32 device and you want to be able to visualize your data in real-time fairly quickly so that you can take actions based on specific events. Well, there are many ways to publish sensor data. Some require time and others are faster to set up. In this blog post, we will go over 5 of the most common methods, describing their advantages and limitations. We will introduce the Arduino Cloud as an easy-to-use IoT solution for all skill levels and with zero maintenance.
5 most common IoT data visualization methods
1. Use a mobile app to visualize data connected via Bluetooth®
Bluetooth is a popular choice for connecting IoT devices to mobile apps. Users can establish a Bluetooth connection, send data from their IoT device to the mobile app, and visualize it in real-time.
Numerous examples of mobile apps and libraries specifically designed for this purpose are available.
Following some of these examples can be easy for medium skill programmers, but it can become a bit tricky when requiring a more advanced visualization solution. Ready-to-use apps are too generic and not flexible enough if you desire a custom dashboard.
Local solutions, like Bluetooth, require you to be physically close to your IoT device to access data, which limits remote monitoring and control.
2. Embed a web server in the device
Embedding a web server inside the IoT device allows you to visualize the data using a web browser. It requires the device to have network connectivity, and it is usually implemented connecting the device to a Wi-Fi access point or with the device creating its own WiFi hotspot.
Although creating your own web server implementation can be done, one of the most widespread solutions is to make use of the library ESPAsyncWebServer. It allows your IoT device to serve custom HTML pages presenting the data. This is a very flexible and customizable solution, yet complex and mostly suitable for skilled users.
There are plenty of insightful examples like the following ones:
The scope of this solution is typically local — you need to be on the same network as the device — although with a more advanced configuration by enabling port forwarding in the router, the device could be accessed remotely from anywhere.
One of the main advantages is its low latency, as the data shown in the web page comes directly from the device without any processing.
On the other hand, it is a solution that requires a high programming skill level and additionally, due to the immutable nature of the firmware, every change in a dashboard requires code recompilation and firmware reflashing.
Furthermore, embedding a web server or a Bluetooth stack within the device can be resource-intensive. This may limit the device’s capabilities or require a more powerful microcontroller, increasing both cost and complexity.
3. Send data to an external system with plotting capabilities
IoT devices can send data to external systems using different protocols, such as MQTT or HTTP. Although there are many HTTP based implementations, the ones based on MQTT are the most popular ones, and it has become the de-facto standard in IoT communication due to its lightweight, efficient, and publish-subscribe model, making it well-suited for resource-constrained devices and scalable, real-time IoT applications.
Sending data to external systems relies on external infrastructure. At least, the following components are needed:
A server that receives (and stores if needed) the data
A web server implementing the application that allows the user to access and visualize the data
Both components can be running on the same machine or on different machines. These machines can typically be self-hosted or cloud-hosted.
Self-hosted platforms: You own the infrastructure — typically in your home or premises — and the machines where the monitoring application runs. There are usually two different ways to implement these systems: – Deploy an (open-source) application on your machines that can be used right away. – Build your full system on your own.
Cloud-hosted platforms: The infrastructure and the machines are in a cloud owned by the application provider.
Regardless of the solution you opt for, some systems offer the ability to integrate with external systems, offering the opportunity to disseminate data across various platforms. One common approach is to facilitate data transfer to platforms such as IFTTT, a widely adopted choice. IFTTT can further facilitate actions like storing data in a MySQL database or appending rows to a Google Sheet.
Let’s deep dive into three examples: Two self-hosted and one cloud-hosted.
3.1. Use a ready-to-use self-hosted system
Self-hosted ready-to-use solutions are very popular and consist of deploying an open-source monitoring application on a machine (usually Linux-based) which is located in your home or premises. For this, you need to build and maintain the infrastructure and guarantee that the machine where the application will be running is available 24/7.
Some very popular open-source examples are Domoticz, openHAB or Home Assistant. They are extremely flexible and full of add-ons or extensions contributed by the community.
Installing these systems can be a straightforward process on the recommended platforms (hardware plus Operating System) but it can become a bit tricky when you want to install them on systems that are already running, as conflicts with the Operating System (OS) or the libraries of the system usually arise and they are usually not very easy to solve. So it can change from an easy task that a beginner can do to a complex task only suitable for skilled users.
Dealing with software updates for the application or the Operating System can become a complicated task as usually conflicts between dependencies arise.
As the add-ons and extensions are developed by the community, they are often not maintained and so they can be buggy and may not work properly across different versions of the application.
Accessing the system remotely from the internet requires opening your router ports and configuring port forwarding, which is something not very intuitive for beginners and that can create security threats in your network.
3.2 Create your own MQTT-based visualization system
This self-hosted solution is the most complex of all the ones described so far, yet the most flexible one.
As an example, imagine that you want to create your own monitoring system using MQTT to populate the data, a database to store it and a visualization platform to plot it. In that case, you need to have one or several machines running:
The MQTT broker. One of the most popular open-source ones is Eclipse Mosquitto.
The application that will subscribe to the data in the broker and store it in a database. Using time-series databases (TSDB) like InfluxDB is gaining popularity.
The visualization platform that will allow you to create dashboards accessible via a web browser. Grafana is one of the most popular open-source platforms to achieve this.
Furthermore, you also have to configure the network so that the machines and the services can talk to each other and so that they can be accessible remotely from the internet. As in the previous method, this means opening your router ports and creating security holes in your network.
And last but not least, you have to configure and maintain the full infrastructure of servers and network.
3.3. Use Arduino Cloud to store and visualize your devices data
The Arduino Cloud is a cloud-hosted platform that provides a user-friendly environment to develop the software of the IoT devices and to create customizable insightful dashboards used to monitor and control your IoT devices.
The main features are:
Online editor or Arduino IDE development: You can develop your projects online from anywhere. No configuration is required from the user to use the online development environment. But, even though online development is very convenient for many users, the development with the popular and well-known Arduino IDE is equally valid. You can choose the right one for you.
Code storage and backup: Whether you develop offline or online, storing your code in the cloud eliminates the need for manual backups and enables development from anywhere.
Customizable dashboards: You can create and customize yourdashboards with an intuitive interface using drag-and-drop widgets. They provide real time interaction with your IoT devices and insightful historical information that can be additionally downloaded for offline analysis. The good thing is that you can share them with friends, colleagues and family as well as set up real-time alerts.
IoT Remote app: Your dashboards are always at your fingertips with the mobile phone app.
Work collaboratively: You can share your code and dashboards with others.
Out-of-the box integrations: You have seamless integration with popular platforms like IFTTT, Zapier, Google Services, or Alexa.
Wide range of compatible devices: You can connect not only Arduino or ESP-based boards, but also any device programmed using Python, JavaScript or MicroPython.
It is free to use for small-sized projects. If you need to connect more devices or need to access premium features such as extended data storage, support for larger projects, over-the-air updates, real-time notifications, you can sign up for a monthly or yearly plan (starting at $2 per month). .
The main limitation of this system is that you require internet connectivity to visualize your device’s data.
Other solutions
These are just some examples, but there are of course many more. It’s worth noting that some users explore hybrid solutions where they maintain their own Cloud-hosted infrastructure. However, these solutions incur in the problems highlighted for both self-hosted and cloud-hosted solutions. Others use websockets to stream data directly to their web pages or applications.
Conclusion
IoT data visualization doesn’t have to be a complex, expensive, or location-dependent task. The selection of the right solution for you depends on your use case and specific needs.
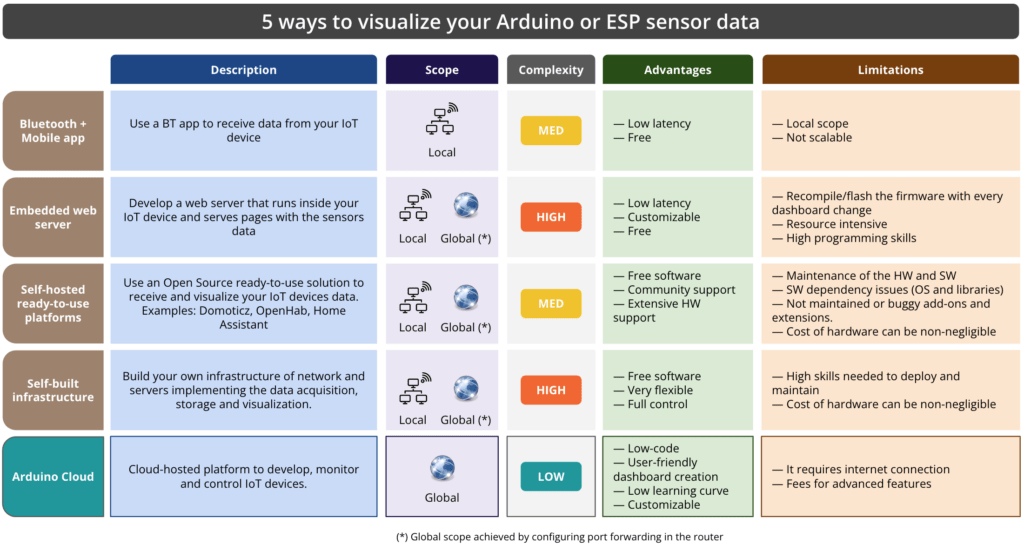
In this blog post, five popular solutions have been presented and they are summarized in the following table:
Some thoughts extracted from the table:
Local scope solutions, like Bluetooth or embedded web servers, require you to be physically close to your IoT device to access data, which limits remote monitoring and control. Providing full global access for some of these solutions requires your router port forwarding configuration, which may create security breaches in your network.
Embedding a web server or a bluetooth stack within the device can be resource-intensive. This may limit the device’s capabilities or require a more powerful microcontroller, increasing both cost and complexity.
Self-hosted ready-to-use platforms have been traditionally the most widely adopted because of its open-source nature, flexibility, community support and wide range of add-ons and extensions. These solutions demand that you build and maintain the infrastructure, making them sometimes complex and time-consuming. Additionally, although the software is free to use, the hardware where they run is becoming increasingly more expensive and difficult to find.
All these limitations have contributed to the popularity increase of cloud-hosted solutions mainly because of their convenient unattended nature, but also because they simplify the development of the devices firmware, their scalability and the customization options available. The main limitations of these solutions are their dependency to an internet connection and that they may incur some costs when advanced features are required.
In this blog post, we have introduced the Arduino Cloud, a cloud-hosted platform designed to simplify the entire process, from firmware development to monitoring and controlling devices from anywhere. The Arduino Cloud was created with the goal of democratizing IoT, much like how Arduino has empowered makers to create with ease. As we have explored, the Arduino Cloud’s online development features, code storage, and intuitive dashboards make it an appealing choice for IoT enthusiasts.
Start with Arduino Cloud for free
Getting started with the Arduino Cloud couldn’t be easier. You only have to follow these steps:
1. Set up an Arduino Cloud account. 2 Connect your IoT device to the Arduino Cloud. 3. Create your Thing and add your software to read your sensors data. 4. Create dashboards for data visualization.
And that’s it. It’s ready to use and it is free. You can explore the premium features for enhanced functionality.
So, if you’re looking to streamline your IoT data visualization, consider giving the Arduino Cloud a try and unlock its full potential for your projects.
Our fall exclusive offer is here, and it’s packed with incredible savings.
With this promotion, you can enjoy a special 30% discount on the Arduino Cloud Maker yearly plan using the code “CLOUDNANO32.” Plus, when you select any other Arduino Cloud yearly plan (Entry, Maker, or Maker Plus), you can grab a Nano ESP32 for just $1!*
How to redeem the offer:
1. Select your yearly plan: Keep in mind that only the Yearly Maker plan is on sale. If you select the yearly Maker plan, be sure to apply the code “CLOUDNANO32” during checkout to unlock an amazing 30% discount.
2. Activate email notifications: To stay in the loop and receive your invitation for the Nano ESP32 at $1, activate your email notification.
3. Get your Nano ESP32 email invitation: Shortly after completing your Cloud subscription purchase, you will receive a special voucher via email, granting you access to the Nano ESP32 for just $1*.
Whether you’re an experienced IoT developer or a newcomer to the IoT world, this promotion offers something for everyone. Upgrade, save, and take your IoT projects to new heights. Act now before the offer expires on October 27th, 2023.
*To be eligible, you shall not have any active Arduino Cloud paid plan. Please note that the Nano ESP32 offer is exclusively available to the first 300 customers who purchase any Arduino Cloud yearly plan (Entry, Maker, or Maker Plus). Shipping fees and taxes apply. Please refer to our Terms & Conditions.
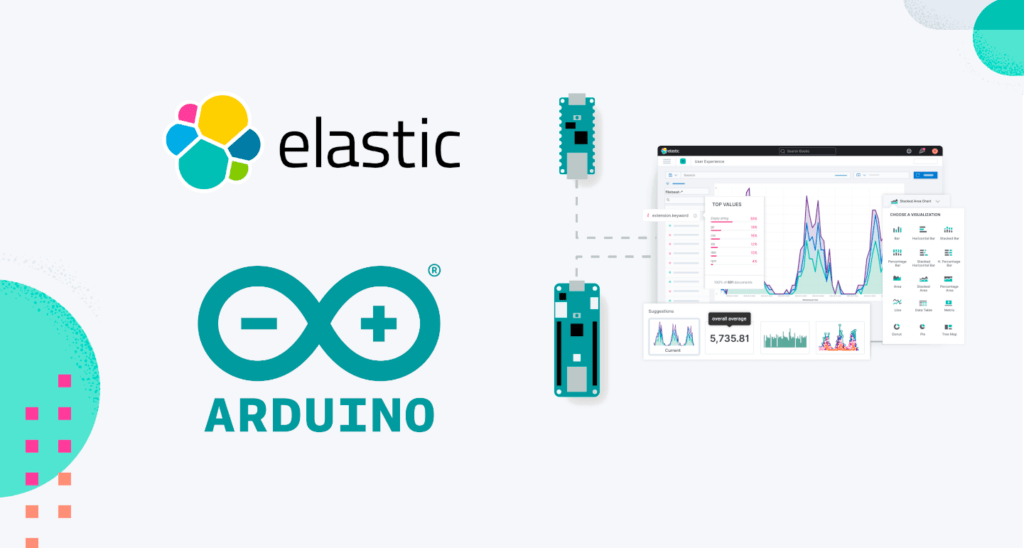
Named Visionary by Gartner for the third year in a row, Elastic is the world’s leading platform for search-powered solutions – and a company we are proud to partner with.
Recently, we collaborated with this data powerhouse on a Portenta H7-based R&D project to provide a simple Elasticsearch client library (written in C++) that runs on Arduino modules. That’s right: you can now communicate with an Elasticsearch server directly from an Arduino board!
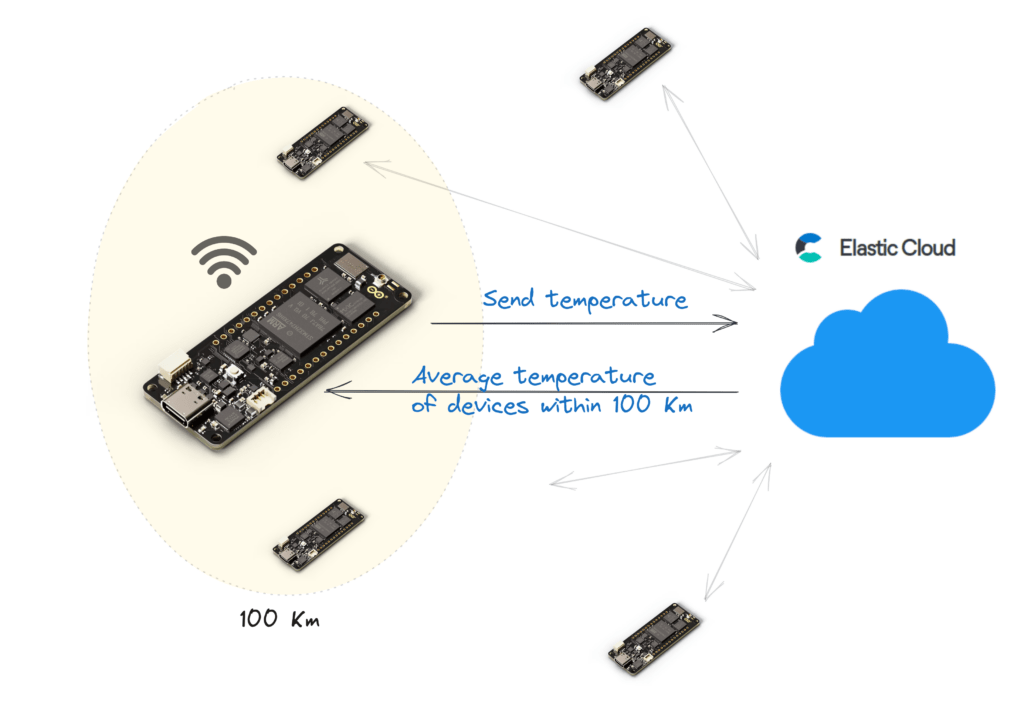
Among the many ways we immediately tested this new opportunity, we tried developing an IoT device that sends temperature data captured by sensors every five minutes to Elastic Cloud. This, combined with Elasticsearch’s geo features, could be the first step in building a solution that provides the current average temperature from all sensors 5 km away upon request.
Want to find out more? Here is a simple tutorial with all the details.
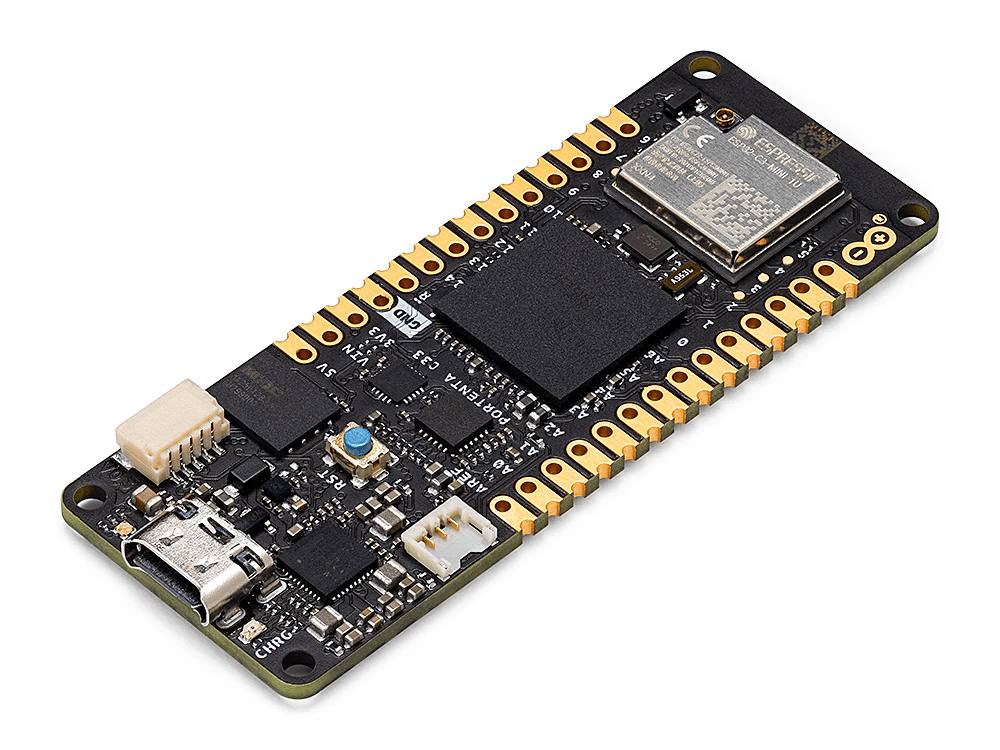
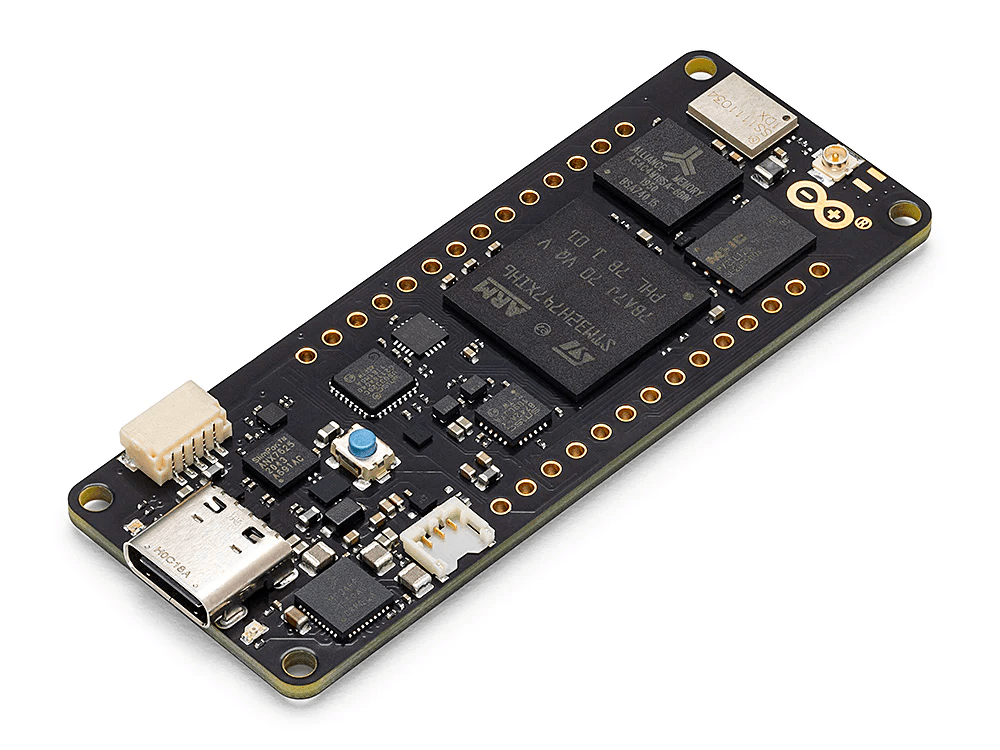
Portenta C33
Portenta H7
What’s more, Arduino Pro’s industrial-grade offerings fit in with the entire Arduino ecosystem, which includes Cloud services, countless software libraries and ready-to-use sketches shared by the community, and of course a wide variety of components to meet any need. These include popular products such as the MKR WiFi 1010 and Nano RP2040 boards – veritable cornerstones of the maker movement.
Use case: temperature feedback from multiple IoT devices
We designed a use case for a company that needed to manage multiple IoT devices located in Italy. Each device sends data coming from sensors (e.g. temperature) to Elastic Cloud. Using Elastic Cloud the company can manage any scale of IoT devices, without the need of managing a dedicated infrastructure. Moreover, the company needs to adjust some internal parameters of each device from the average temperature of neighboring devices, in a range of 100 km. This is a typical scenario in control engineering applications.
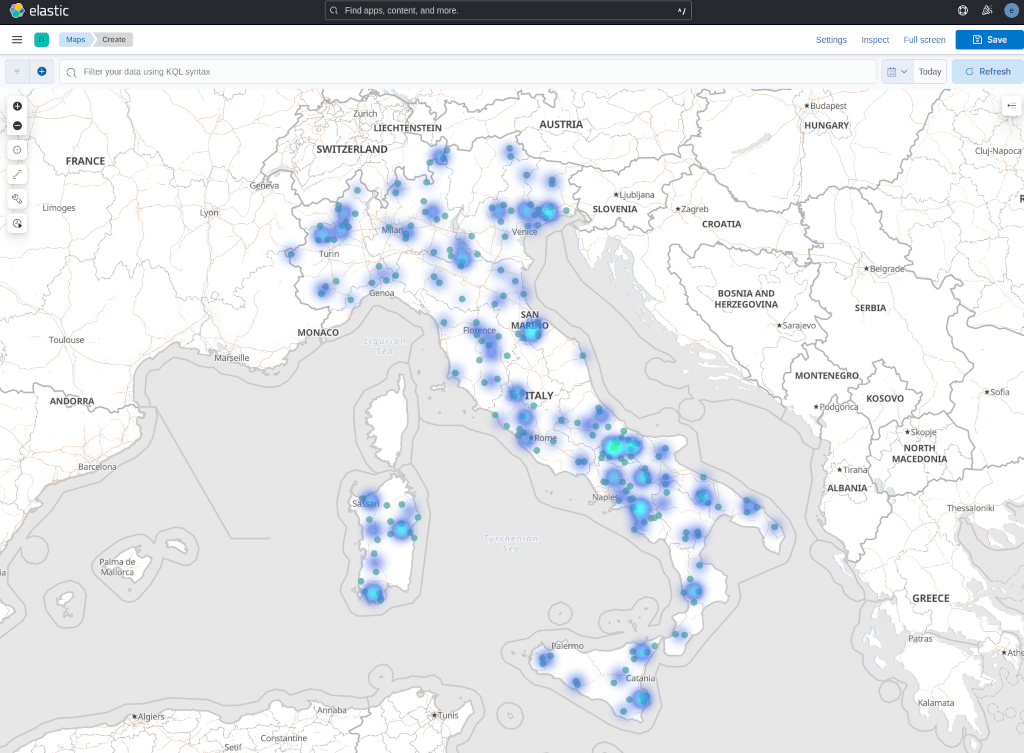
Using Kibana, the UI available in Elastic Cloud, we can easily create a dashboard to monitor the data coming from all the devices. Since we also have geo-data we can represent this information on a map.
This is a heat map created with different colors representing different temperatures (blue is cold and green, red are hot).
Setup of Elastic Cloud
The first step is to have an account for Elastic Cloud. If you don’t have one you can register for a trial here (no credit card required). Once you login you can create a new deployment, choosing the size of the Elasticsearch instances that you want to use.
Once you have created a deployment, you need to retrieve the endpoint URL and generate an API key of Elasticsearch. You can read this guideline for support on obtaining this information.
Preparing Elasticsearch index
We need to create an index to store the data coming from the Arduino boards. We want to store temperature values, position of the device using geo-location (latitude and longitude), a device identifier name, and a timestamp.
We can create an index “temperature” with the following HTTP request to Elasticsearch:
To send this HTTP request you can use the Dev Tools of Kibana in Elastic Cloud.
We want to store the timestamp of the operation each time a device sends data. This can be done using the ingest pipeline feature of Elasticsearch. An ingest pipeline is an action that Elasticsearch executes before indexing (storing) a document. For instance, a pipeline can assign the value of a specific document field, based on some calculation.
In our case, we just need to store the timestamp and we can create a “set-timestamp” pipeline:
PUT _ingest/pipeline/set-timestamp
{
  "description": "sets the timestamp",
  "processors": [
    {
      "set": {
        "field": "timestamp",
        "value": "{{{_ingest.timestamp}}}"
      }
    }
  ]
}
Using this pipeline we can then send data to Elasticsearch as follows:
Here the device-id H7-001 is the name of the Arduino board and location is the geographic point expressed with 12.4923 (longitude) and 41.8903 (latitude), that is the position of the Colosseum in Rome (Italy).
Notice that we did not specify the timestamp value because this is automatically generated using the “set-timestamp” pipeline (specified in the URL as query string).
Geo-distance query
To retrieve the average temperature of the devices distance up to 100 km we can use the following Elasticsearch query:
This query will return an “avg_temp” aggregation field containing the average temperature of all devices within a radius of 100 km.
Usage of the Elasticsearch client for Arduino
It’s finally time to show some Arduino code! Below is a simple sketch that sends a temperature value to Elastic Cloud, gets the average temperature performing a geo-distance query and waits for 30 seconds.
The code reported here is available online in the examples folder of the elastic/elasticsearch-arduino github repository. The sketch uses an elasticsearch_config.h file as follows:
In our example, we used Wi-Fi to connect the Arduino board to the internet.
The WIFI_SECRET_SSID and the WIFI_SECRET_PASS are the name of the SSID network to use and the Wi-Fi password.
The ELASTIC_ENDPOINT is the URL of the Elastic Cloud endpoint, the ELASTIC_PORT is 443 since Elastic Cloud uses TLS (https). The ELASTIC_CLOUD_API_KEY is the API key to be generated in the Elastic Cloud admin interface.
This file also contains other information related to the Arduino device. We have the longitude (DEVICE_GEO_LON) and latitude (DEVICE_GEO_LAT), the ID (DEVICE_ID) and the distance (DEVICE_GEO_DISTANCE) for the geo-query.
After filling all the previous information, we can have a look at the sketch, reported as follows:
#include <ArduinoJson.h>
#include <WiFi.h>
#include <WiFiSSLClient.h>
#include "ESClient.h"
#include "elasticsearch_config.h"

// WiFi settings
char ssid[] = WIFI_SECRET_SSID;
char pass[] = WIFI_SECRET_PASS;

// Elastic settings
char serverAddress[] = ELASTIC_ENDPOINT;
int serverPort = ELASTIC_PORT;

WiFiSSLClient wifi;

ESClient client = ESClient(wifi, serverAddress, serverPort);
int status = WL_IDLE_STATUS;

void setup() {
  Serial.begin(9600);
  Serial.println("Started");

  while (status != WL_CONNECTED) {
    Serial.print("Attempting to connect to Network named: ");
    Serial.println(ssid);

    // Connect to WPA/WPA2 network:
    status = WiFi.begin(ssid, pass);
  }

  // print the SSID of the network you're attached to:
  Serial.print("SSID: ");
  Serial.println(WiFi.SSID());

  // print your WiFi shield's IP address:
  IPAddress ip = WiFi.localIP();
  Serial.print("IP Address: ");
  Serial.println(ip);

  client.setElasticCloudApiKey(ELASTIC_CLOUD_API_KEY);
}

void loop() {

  float temperature;
  // Set the temperature from a sensor (removing the randomness)
  temperature = random(10,30) + random(0,100)/100.00;

  // Prepare the JSON with temperature and geopoint for Elasticsearch
  StaticJsonDocument<200> doc;
  doc["temperature"] = temperature;
  doc["device-id"] = DEVICE_ID;
  doc["location"]["type"] = "Point";
  doc["location"]["coordinates"][0] = DEVICE_GEO_LON;
  doc["location"]["coordinates"][1] = DEVICE_GEO_LAT;

  String temp;
  serializeJson(doc, temp);

  Serial.println("Sending to Elasticsearch:");
  Serial.println(temp);
  ESResponse indexResult;
  // Send the temperature to Elastic Cloud
  indexResult = client.index("temperature", temp, "pipeline=set-timestamp");

  DynamicJsonDocument result(1024);
  deserializeJson(result, indexResult.body);

  if (result["result"] == "created") {
    Serial.println("Created with _id: " + result["_id"].as<String>());
  } else {
    Serial.println("Error sending data: " + indexResult.body);

  }

  StaticJsonDocument<512> query;
  query["query"]["bool"]["filter"]["geo_distance"]["distance"] = DEVICE_GEO_DISTANCE;
  query["query"]["bool"]["filter"]["geo_distance"]["location"][0] = DEVICE_GEO_LON;
  query["query"]["bool"]["filter"]["geo_distance"]["location"][1] = DEVICE_GEO_LAT;
  query["aggs"]["avg_temp"]["avg"]["field"] = "temperature";
  query["size"] = 0;

  String search;
  serializeJson(query, search);
  Serial.println("Geo-location query:");
  Serial.println(search);

  ESResponse searchResult;
  // Send the temperature to Elastic Cloud
  searchResult = client.search("temperature", search);

  DynamicJsonDocument avg(512);
  deserializeJson(avg, searchResult.body);
  float avgTemp = avg["aggregations"]["avg_temp"]["value"];
  int numDevices = avg["hits"]["total"]["value"];
  Serial.println("Average temperature of " + String(numDevices) + " devices in " + DEVICE_GEO_DISTANCE + ": " + String(avgTemp));

  Serial.println("Wait 30 seconds");
  delay(30000);
}
This sketch requires Wi-Fi, WiFiSSLClient (for connecting using TLS) for the internet connection, the EsClient for connecting to Elasticsearch and the ArduinoJson library for serializing and deserializing Json data structure.
In the setup() function we start the Wi-Fi connection and we set the API key of Elastic Cloud using client.setElasticCloudApiKey(ELASTIC_CLOUD_API_KEY) function call. The client object is initialized in the main area passing the Wi-Fi object, the server address (endpoint) and the HTTP port. In the loop() function we have the code that sends the temperature to Elastic Cloud. The temperature here is just a random float number between 10 and 30, typically coming from a sensor attached to the Arduino board. To prepare the document to send to Elasticsearch, we used the ArduinoJson library.
We used the following code to create a “doc” object:
This object is serialized in a JSON string as follows:
String temp;
serializeJson(doc, temp);

Finally, the document, stored in the “temp” variable, can be sent to Elasticsearch using the index API, as follows:

ESResponse indexResult;
indexResult = client.index("temperature", temp, "pipeline=set-timestamp");

This API adds the “temp” document in the index “temperature” using the “set-timestamp” pipeline. The result is stored in the “indexResult” variable that is a struct type as follows:

struct ESResponse {
    int statusCode;
    String body;
};
The “statusCode” is the HTTP status code of the response and “body” is the response body. The index operation is successful if the response contains a “result” field with value “created”.
To get the average temperature of the devices within a radius of 100 km, we used the following geo-distance query, expressed using ArduinoJson.
The response of the search contains the average temperature, as an aggregation value. Moreover, we can retrieve the number of devices retrieved by the query using the [‘hits’][‘total’][‘value’] field in the JSON response from Elasticsearch.
Conclusion
Thanks to the collaboration with Arduino, we developed a very simple library that allows the usage of Elasticsearch directly from an Arduino board. In a few lines of code we can send data to Elasticsearch and execute complex elaborations, using geolocation and more.
We can’t wait to see what Arduino users will come up with, using Elasticsearch! For instance, if you are interested in generative AI you will certainly enjoy Elastic’s newest features. Give Elastic Cloud and the elasticsearch-arduino library a try!
Planet Arduino is, or at the moment is wishing to become, an aggregation of public weblogs from around the world written by people who develop, play, think on Arduino platform and his son. The opinions expressed in those weblogs and hence this aggregation are those of the original authors. Entries on this page are owned by their authors. We do not edit, endorse or vouch for the contents of individual posts. For more information about Arduino please visit www.arduino.cc
You are currently browsing the archives for the Arduino Cloud category.